
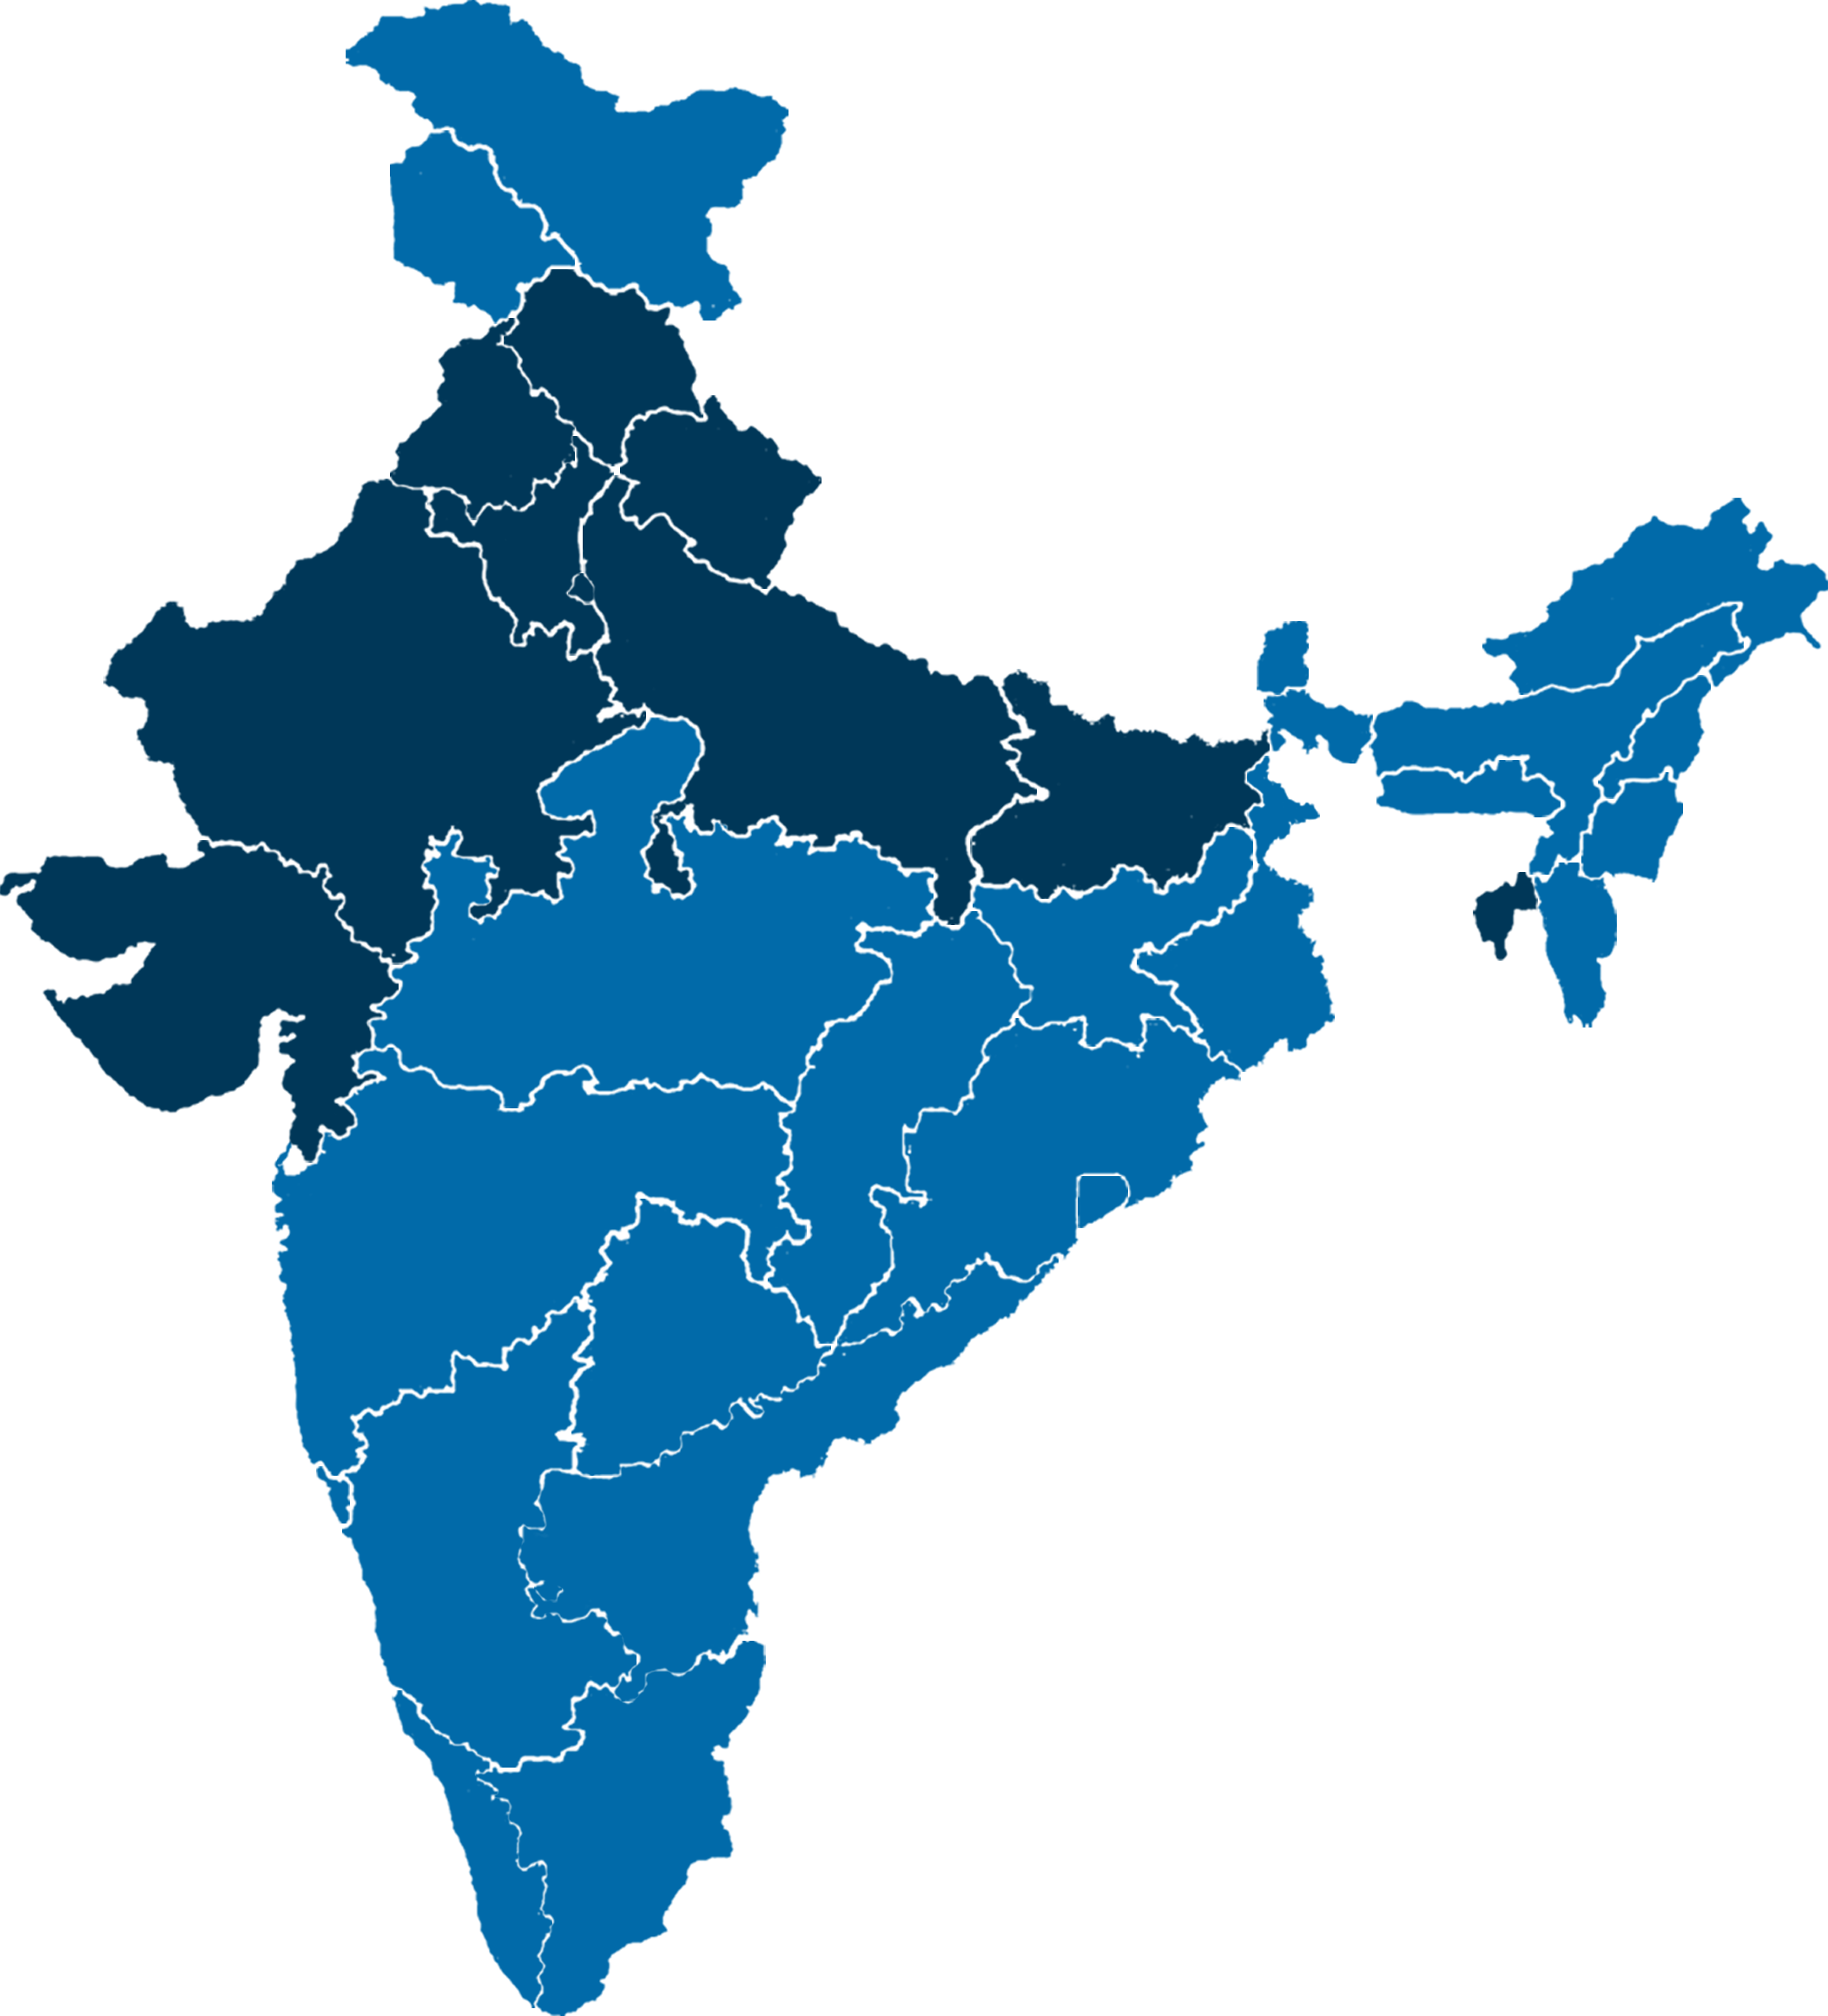

Uttar Pradesh Election Data Analysis Report: The Complete 2026 Guide
A data-driven breakdown of UP constituencies — BJP vs SP vs BSP vote share across four elections, booth and panchayat-level grading, swing analysis, and a priority action plan for every seat in the state.
Why UP Results Alone Are Not Enough
Uttar Pradesh is India's largest state and its most consequential election battleground — 403 Assembly seats, 80 Lok Sabha seats, and over 15 crore electors. A single seat result tells you who won. It does not tell you why, or where the next election will be decided. That is the gap a Uttar Pradesh election data analysis report fills.
In 2017, the BJP won a landslide — 312 seats with 39.7% vote share [citation:27]. By 2022, it had lost 57 seats but gained vote share, winning 255 seats with approximately 41.3% . By 2024, the picture had shifted again: BJP fell to 33 Lok Sabha seats in UP, down from 62 in 2019, while the SP-Congress alliance surged [citation:2][citation:17]. Three elections, three different stories — and only a multi-election, booth-level analysis can explain what connects them.
This is what a proper UP constituency analytics report delivers: not a summary of one result, but a forensic breakdown of a seat across four elections (2017, 2019, 2022, 2024), at booth and panchayat level, graded against the strongest rival — SP, BSP, Congress or RLD — and converted into a plan. It is the difference between knowing the score and understanding the game.
For political parties, campaign managers, journalists, and research organisations, a UP election data analysis report is not a luxury — it is a necessity. In a state where a few thousand votes in a handful of booths can decide the fate of a government, granular data is the only reliable guide to strategy. This guide breaks down exactly what such a report contains, why it matters, and how it transforms raw election results into actionable intelligence.
In this UP guide
- What is a UP election data analysis report?
- The problem with UP seat-level results
- Why four elections: UP 2017 → 2024
- Panchayat and booth grading in UP
- Swing analysis: where UP votes moved
- UP battlegrounds
- The five-group priority plan for UP
- A UP worked example
- Why every UP constituency needs one
- UP election FAQs
What Is a UP Election Data Analysis Report?
A structured, data-driven breakdown of a single UP assembly constituency — or the whole state — across multiple elections, at booth and panchayat level.
A Uttar Pradesh election data analysis report measures political performance across several elections, at two levels of granularity, and produces a prioritised action plan. In UP, where the BJP faces a rotating cast of rivals — SP, BSP, Congress, RLD, and Apna Dal — the report tracks all of them in every booth. This is not a simple vote-count summary; it is a forensic tool for understanding political geography at its most granular level.
The report typically covers four election cycles: the 2017 Assembly election, the 2019 Lok Sabha election, the 2022 Assembly election, and the 2024 Lok Sabha election. Each of these elections had a fundamentally different political dynamic — a BJP wave in 2017, a Modi surge in 2019, an SP resurgence in 2022, and an INDIA bloc consolidation in 2024. By analysing all four together, the report captures the full arc of UP's electoral evolution, not just a single snapshot.
Booth-level analysis in UP
The polling station is where UP elections are actually won. With over 1.6 lakh polling stations across the state, booth-level analysis shows where BJP gained or lost against SP, BSP and Congress at the finest possible scale. Each booth is a microcosm of the broader political reality — and the booth-level data is what separates a real analysis from a superficial one.
Panchayat-level analysis in UP
UP has over 58,000 gram panchayats. Grouping booths into panchayats gives a field team the practical unit for organising a village-level campaign — which panchayat is a "Hold," which is "Win back," and which is "Long-term build." Panchayat-level analysis bridges the gap between micro booth data and macro constituency totals, making it the most actionable geographic unit in UP politics.
In UP, the report covers four elections that define the current political landscape: the 2017 Assembly (BJP landslide, 312 seats), the 2019 Lok Sabha (BJP 62 seats, 49.56% vote share), the 2022 Assembly (BJP 255 seats, SP surge), and the 2024 Lok Sabha (BJP 33 seats, SP-Congress gain) [citation:2][citation:27][citation:28]. Each of these elections represents a different chapter in the state's political story, and together they form a complete picture of where the BJP stands and where it is vulnerable.
| Coverage in a UP report | Figure |
|---|---|
| Assembly constituencies (state-wide) | 403 |
| Lok Sabha constituencies (state-wide) | 80 |
| Elections analysed | 4 (2017, 2019, 2022, 2024) |
| BJP peak Assembly seats | 312 (2017) |
| BJP 2024 Lok Sabha seats in UP | 33 (down from 62 in 2019) |
The report is not just for political parties. Journalists use it to understand regional trends. Academic researchers use it to study voting behaviour. Civil society organisations use it to map development needs against political representation. And campaign strategists use it to decide where to spend their time, money, and manpower. In every case, the UP election data analysis report provides the empirical foundation that opinion and intuition cannot replace.
The Problem With UP Seat-Level Results
In a state with 403 seats and three major parties, a seat total is an average of wildly different places.
When a party wins 255 seats, the headline number masks enormous variation. It hides the fact that some seats were won by huge margins while others were won by a few hundred votes. It hides the fact that some regions swung dramatically toward the opposition while others stayed loyal. And it hides the fact that different social groups voted in different ways across different parts of the state. A UP election data analysis report corrects all of this by going below the surface of the headline number.
It hides the geography
BJP won 255 seats in 2022 — but lost 84 seats it had held in 2017. A state total hides which seats flipped, and whether they were urban, rural, Jat-dominated or Dalit-majority. The geography of a seat's loss or gain is often more revealing than the loss itself — it tells you whether you have a problem with a specific community, a specific region, or a specific type of constituency.
It hides the vote-share paradox
In 2022, BJP lost 57 seats but its vote share rose by almost 2 points. A seat total says "BJP weakened." The vote share says "BJP consolidated while SP consolidated faster." This paradox is at the heart of UP's political arithmetic — and only a booth-level analysis can explain it. It is not enough to know who won; you must know why they won and how durable that victory is.
It hides the 2024 collapse
BJP fell from 62 to 33 Lok Sabha seats in UP between 2019 and 2024 — a loss of 29 seats. The state-wide swing was not uniform: the Opposition made major gains in west UP, Rohilkhand and Bundelkhand [citation:2][citation:26]. A seat total hides the regional pattern of these losses. Some of these losses were due to national factors, others to local factors — and a proper report separates the two.
It hides the battlegrounds
In 2022, 39 seats were won by margins under 2,000 votes, compared to just 17 in 2017. These are the seats where a small booth-level swing changes the government. A seat total treats a 50,000-vote victory and a 500-vote victory as the same. A proper UP election data analysis treats them as fundamentally different — because in the next election, one is safe and the other is not.
Why Four Elections: UP 2017 → 2024
One UP election is a photograph. Four elections are a film — and UP's film has three radically different chapters.
UP's electoral arithmetic has shifted dramatically in seven years. A proper report deliberately mixes Assembly elections (2017, 2022) — where local candidates and village dynamics dominate — with Lok Sabha elections (2019, 2024), where the national wave and alliance arithmetic take over. This mix is not accidental: it captures both the local and national dimensions of UP politics, which are always intertwined.
The 2017 Assembly election was a landslide for the BJP, which won 312 seats with 39.7% vote share. It was the biggest majority for any party in UP since 1977. The BSP was reduced to 19 seats, and the SP to 47. The 2019 Lok Sabha election saw the BJP win 62 seats with 49.56% vote share — a peak that reflected the Modi wave. By 2022, the BJP had lost 57 seats but gained vote share, winning 255 seats with approximately 41.3%. The SP surged to 111 seats, and the BSP collapsed to just 1 seat. Then in 2024, the BJP fell to 33 Lok Sabha seats — down from 62 — while the SP-Congress alliance gained significantly, with the SP winning 37 seats and Congress 6. The BJP's vote share dropped from 49.56% to 41.37%.
| Election | BJP seats | BJP vote share | Winner / lead party | Runner-up seats |
|---|---|---|---|---|
| 2017 Assembly | 312 | 39.7% | BJP | SP 47 |
| 2019 Lok Sabha | 62 | 49.56% | BJP | SP 5, BSP 10 |
| 2022 Assembly | 255 | ~41.3% | BJP | SP 111 |
| 2024 Lok Sabha | 33 | 41.37% | SP (37 seats) | Congress 6 |
Sources: ECI, IndiaVotes, The Wire, Times of India [citation:2][citation:22][citation:26].
Biggest majority for any party in UP since 1977. BSP reduced to 19 seats [citation:27]. The BJP's vote share was 39.7%, but its seat conversion was extraordinary.
BJP lost 84 seats it held. BSP collapsed from 19 to 1 seat. Congress fell to 2. The SP's vote share rose to 32%, and its seat count more than doubled.
SP won 37 seats, Congress 6. BJP vote share fell from 49.56% to 41.37% [citation:2][citation:26]. The INDIA bloc's vote share reached 43.52%.
The four-election framework also allows the report to distinguish between structural trends and cyclical fluctuations. A party that loses seats in one election may recover in the next — but a party that loses vote share across multiple elections has a deeper problem. By looking at all four elections together, the report can identify which losses are temporary and which are structural, which gains are durable and which are fragile. This is the kind of insight that no single election result can provide.
Panchayat and Booth Grading in UP (A to D)
Every UP panchayat and booth gets a grade based on BJP performance against its strongest rival — SP, BSP, Congress or RLD.
This is the layer that turns UP's vast data into a prioritised map. Each rural panchayat and booth receives a grade — A, B, C or D — based on how the BJP performed against its strongest rival in that unit. Two systems run in parallel: an overall grade that considers all four elections, and a single-election grade that focuses on the most recent contest. Together, they provide a complete picture of where the BJP is strong, where it is weak, and where it is vulnerable.
Overall grade (all four elections)
- Grade A: BJP led every election, averaged 50%+
- Grade B: led all but one election
- Grade C: led at least once
- Grade D: never led
This grade is the long-term view. A Grade A booth is a BJP fortress. A Grade D booth is opposition territory. The middle grades are where elections are decided.
Single-election grade
- Grade A: BJP at 55% or more
- Grade B: BJP ahead, under 55%
- Grade C: BJP behind by under 10 points
- Grade D: BJP behind by 10 points or more
This grade is the current view. It tells you what happened in the most recent election, and where the immediate opportunities and threats are.
In UP, this grading reveals a party that is strong in its core but vulnerable in the middle. The 2022 Assembly result showed BJP holding 255 seats, but with 39 seats won by margins under 2,000 votes — a sharp reversal from 2017, when only 17 seats were that close. The grade distribution in a typical UP constituency shows a large Grade A core (BJP-dominant booths), a thinning Grade C middle (where SP made inroads), and a Grade D block that is often minority-concentrated or opposition stronghold.
The Grade C middle is the most important group in UP politics. These are booths where the BJP is ahead but not comfortably — and where a small swing can change the result. In 2017, many of these booths were Grade A or B. By 2022, they had slipped to Grade C. And in 2024, many of them flipped to the opposition. A UP election data analysis report identifies these booths specifically, so that campaign resources can be directed where they will have the greatest impact.
The grading system is not just descriptive — it is prescriptive. Once a booth or panchayat is graded, the campaign strategy follows automatically. Grade A booths need to be protected (turnout management, booth-level workers). Grade B booths need to be consolidated (targeted outreach, local issue resolution). Grade C booths need to be won back (opposition research, counter-narratives). And Grade D booths need long-term investment (community building, presence over the full cycle). This is how a UP constituency analytics report turns data into action.
Where UP Votes Moved
Grading tells you where BJP stands. Swing analysis tells you where votes are moving — and in UP, direction is everything.
The core tool is a panchayat-level swing chart: each panchayat plotted by BJP lead in one election against the next. In UP, the 2017 → 2022 swing was defined by SP's surge and BSP's collapse: SP gained almost 10 percentage points in vote share, while BSP lost roughly the same amount. The 2022 → 2024 swing was different: BJP's vote share fell from ~41.3% to 41.37% — almost flat — but the Opposition consolidated, with SP's INDIA bloc vote share reaching 43.52% [citation:26].
This distinction matters because it shows that vote share and seat count are not the same thing. In 2022, the BJP's vote share was stable, but its seat count fell because the opposition's vote was more efficiently distributed. In 2024, the BJP's vote share fell slightly, but its seat count fell dramatically because the opposition's vote was even more efficiently distributed. Swing analysis reveals these efficiency changes, which are invisible in a simple seat count.
A UP election swing analysis also identifies the direction and magnitude of vote transfers. When the BSP collapsed in 2022, where did its votes go? Did they go to the SP, the BJP, or did they stay at home? The answer varies by region and by community. In some parts of UP, BSP votes transferred to the SP. In others, they transferred to the BJP. And in still others, they simply did not transfer at all — leading to a lower turnout and a lower winning margin. A proper swing analysis maps these transfers booth by booth, revealing the complex dynamics that a simple seat count cannot capture.
Another critical element of swing analysis is turnout differentials. In UP, different communities and different regions have different turnout patterns. A swing in vote share may be offset or amplified by a swing in turnout. For example, if the BJP's vote share stays the same but turnout in its strongholds falls, its seat count will fall. Conversely, if the opposition's vote share stays the same but turnout in its strongholds rises, its seat count will rise. Swing analysis incorporates turnout data to provide a complete picture of what actually happened at the booth level.
Want this analysis for your UP constituency?
Booth-level and panchayat-level analytics for any of UP's 403 Assembly or 80 Lok Sabha seats — graded and mapped to a clear action plan.
UP Battlegrounds
In 2022, 39 seats were won by margins under 2,000 votes. These are UP's real battlegrounds.
Not all UP seats are equal. A seat won by 50,000 votes is not a battleground; a seat won by 500 votes is. In 2017, 63 BJP candidates won by 50,000+ votes. In 2022, that number fell to 27, while seats won by under 2,000 votes jumped from 17 to 39. UP became dramatically more competitive at the booth level.
This shift from safe seats to close contests is one of the most important trends in UP politics. It means that the BJP's 2022 victory, while impressive in terms of seat count, was much more fragile than its 2017 victory. Many of the seats it won in 2022 could easily have gone the other way — and in 2024, many of them did. A UP battleground analysis identifies these close seats and explains why they are close, so that the party can defend them in future elections.
A UP report pairs the battleground list with a second list: seats BJP led in 2022 but lost in 2024. These are the highest-priority recovery targets, because they contain votes the party recently had and can most plausibly reclaim. If the BJP can identify the specific booths and panchayats where it lost ground between 2022 and 2024, it can design a targeted campaign to win them back. This is the essence of a UP constituency analytics report — turning electoral history into a roadmap for the future.
The battleground analysis also considers the nature of the contest. Some seats are close because of caste arithmetic. Others are close because of local issues. Still others are close because of the personal popularity (or unpopularity) of the sitting MLA or MP. A proper report distinguishes between these different types of battlegrounds, because each requires a different type of campaign response. A caste-based battleground needs social outreach; an issue-based battleground needs policy messaging; a personality-based battleground needs local candidate selection. Understanding the why of a battleground is as important as knowing the where.
Five Groups, One UP Plan Each
Every UP panchayat is placed in one group, using both the 2022 and 2024 results.
The five-group framework is the operational heart of a UP election data analysis report. It takes the raw data from grading and swing analysis and converts it into a simple, actionable classification. Every panchayat in the state — and by extension, every booth and every constituency — falls into one of these five groups. Each group has a clear plan attached to it, so that campaign managers know exactly what to do in each area.
| Group | Rule | UP-specific plan |
|---|---|---|
| Hold | BJP led in 2022 and 2024 with 55%+ both times | Lock in the urban and core rural booths; poll-day turnout. These are the safest areas, but they cannot be taken for granted. |
| Defend | BJP led both years, under 55% at least once | Lift above 55% before SP's booth machinery closes the gap. These are the vulnerable wins that need protection. |
| Win back | BJP led in 2022 but lost in 2024 | Reverse the 2024 loss — especially in west UP and Rohilkhand. These are the highest-priority recovery targets. |
| Within reach | Behind, but within 10 points | Close single-digit gaps with targeted outreach. These are the swing areas that could go either way in the next election. |
| Long-term build | Top rival ahead by 10+ points in both years | Build booth presence over the full cycle. These are the opposition strongholds that require patience and persistence. |
The five-group framework is powerful because it is simple enough to be understood by everyone — from the party president to the booth-level worker. A booth worker in a "Hold" panchayat knows that their job is to maintain the status quo. A booth worker in a "Win back" panchayat knows that their job is to reverse a recent loss. This shared understanding is what makes a UP election data analysis report so valuable: it creates a common language and a common strategy across the entire party apparatus.
The framework is also dynamic. As new elections happen and new data becomes available, panchayats can move from one group to another. A "Win back" panchayat that is successfully recovered becomes a "Hold" panchayat. A "Hold" panchayat that starts to slip becomes a "Defend" panchayat. This dynamic quality ensures that the report remains relevant and actionable over time, rather than becoming a stale document that is filed away and forgotten.
A UP Worked Example: The BJP Paradox
How the layers combine to explain UP's most confusing trend.
The "BJP paradox" is the defining puzzle of UP politics in the post-2017 era: how can a party's vote share stay stable or even rise, while its seat count falls dramatically? The answer lies in the interaction between grading, swing, and battleground analysis. By combining these layers, a UP election data analysis report can explain the paradox and, more importantly, tell the party what to do about it.
BJP landslide. 39.7% vote share. SP 47, BSP 19 [citation:27]. The BJP's seat conversion was exceptionally efficient.
Lost 84 seats it held, but vote share rose ~2 points. SP surged to 111. The BJP's vote share was stable, but its seat conversion became less efficient.
Down from 62. SP 37, Congress 6. BJP vote share 41.37% [citation:2][citation:26]. The paradox deepened as the opposition consolidated.
Seats won by under 2,000 votes, 2017 → 2022. UP became far more competitive, and the BJP's margins thinned dramatically.
Assembly seats 2017 → 2022 → 2024 LS. BSP became marginal [citation:26]. Its votes transferred in complex ways across different regions.
In 2024, Congress won Sitapur, Saharanpur, Rae Bareli, Amethi, Barabanki and Allahabad [citation:26]. The Congress resurgence added a new variable to UP's arithmetic.
The paradox is explained by three factors. First, the opposition's vote became more efficient: the SP and Congress learned to concentrate their votes in winnable seats, rather than spreading them thinly across the state. Second, the BJP's margins thinned: many seats that the BJP won comfortably in 2017 were won narrowly in 2022, making them vulnerable to small swings. Third, turnout patterns changed: in some areas, the BJP's core voters turned out at lower rates, while the opposition's core voters turned out at higher rates. Together, these three factors explain how a party can maintain its vote share while losing seats — and they point the way toward a recovery strategy.
For the BJP, the lesson of the paradox is clear: vote share is not enough. The party must focus on where its votes are, not just how many it has. A vote in a safe seat is worth less than a vote in a battleground seat. A UP election data analysis report helps the party identify these battleground seats and redirect its resources accordingly. For the opposition, the lesson is equally clear: consolidation works. By uniting behind a single candidate in each seat, the opposition can convert a minority of votes into a majority of seats. This is the arithmetic that drove the SP-Congress alliance in 2024 — and it is the arithmetic that will shape UP politics for years to come.
Why Every UP Constituency Needs One
Whether you are a candidate, a party worker, a journalist, or a researcher, a UP constituency analytics report is an essential tool.
Turns a UP result into a strategy
"We won 255 seats" is not actionable. "We lost 84 seats we held, and 39 seats were decided by under 2,000 votes" is. A UP election data analysis report converts a headline into a roadmap, with clear priorities and clear actions.
Finds the 2024 gaps
BJP lost 29 Lok Sabha seats in UP. A report shows which booths and panchayats flipped, and by how much [citation:2]. This is the difference between knowing you lost and knowing why you lost — and between knowing why you lost and knowing how to win next time.
Protects the 2022 gains
SP jumped from 47 to 111 seats. A report shows which of those gains are reversible and which are entrenched. It distinguishes between a temporary swing and a permanent realignment, so that the party knows where to invest and where to let go.
Makes UP's scale manageable
403 seats and 1.6 lakh booths are not a strategy. Grading and grouping turn scale into a prioritised map. Instead of trying to be everywhere at once, a party can focus its resources on the places where they will have the greatest impact.
Tracks the moving UP rival
BSP in 2017. SP in 2022. SP-Congress in 2024. A UP report tracks all of them, not last election's opponent. In a state where the opposition is constantly shifting, a static analysis is worse than no analysis at all.
Creates a common UP language
A graded, grouped report gives a candidate, a district team and a state HQ the same map — and ends a great deal of argument. When everyone is looking at the same data, decisions become faster and more coherent.
Beyond these six reasons, a UP election data analysis report serves a broader democratic purpose. It makes elections more transparent and more accountable. When citizens and journalists can see exactly how their representatives won and by how much, they can hold them to account more effectively. When parties can see exactly where they are weak, they can respond to public concerns more precisely. And when researchers can see exactly how voting patterns are changing, they can understand the deeper social and economic forces that shape UP politics. In this sense, a UP election data analysis report is not just a campaign tool — it is a public good.
For international audiences and comparative scholars, UP is a crucial case study. It is the largest state in the world's largest democracy, and its electoral dynamics have implications far beyond its borders. A UP election data analysis report provides the empirical foundation for studying questions of federalism, coalition politics, caste arithmetic, and democratic consolidation. It is a resource not just for those who work in UP, but for anyone who wants to understand how democracy works at scale.
Uttar Pradesh Election FAQs
What is a Uttar Pradesh election data analysis report?
It is a data-driven breakdown of a UP assembly constituency across multiple elections (2017, 2019, 2022, 2024), at booth and panchayat level, that grades BJP performance against SP, BSP and other rivals, and produces a prioritised action plan. It goes beyond simple seat counts to reveal the underlying patterns of voting behaviour, geographic variation, and swing dynamics.
How many assembly seats does Uttar Pradesh have?
Uttar Pradesh has 403 assembly constituencies and 80 Lok Sabha seats. The 2022 Assembly election was contested across all 403 seats.
What happened to BJP vote share in UP between 2017 and 2022?
BJP won 312 seats in 2017 with 39.7% vote share. In 2022 it won 255 seats with approximately 41.3% vote share — a seat loss but a vote share gain, while SP surged from 47 to 111 seats and BSP collapsed from 19 to 1 seat [citation:27].
Why did BJP lose seats in UP 2024 Lok Sabha?
BJP fell from 62 seats in 2019 to 33 seats in 2024 in UP, losing 29 seats. The SP-Congress alliance gained significantly, with SP winning 37 seats and Congress 6. BJP vote share dropped from 49.56% to 41.37% [citation:2][citation:26][citation:28].
What is panchayat-level election analysis in UP?
It groups polling booths into rural governance units (gram panchayats) to show where BJP led or trailed against SP, BSP and other rivals. This is the practical unit for organising a village-level campaign in UP.
Can this UP election analysis be done for any constituency?
Yes. The framework applies to any of the 403 UP assembly constituencies or 80 Lok Sabha constituencies. Only the candidates, rivals and booth-level data change.
What are the key factors in UP election analysis?
Key factors include caste demographics, booth-level voting patterns, panchayat-level swing, alliance arithmetic, urban-rural divide, and the shifting rivalry between BJP, SP, BSP and Congress. A comprehensive report considers all of these factors together, rather than looking at any one in isolation.
How often should UP election data analysis be updated?
Ideally after every election cycle — 2017, 2019, 2022, and 2024 — plus periodic updates from local body polls and by-elections to maintain an accurate picture of booth-level trends. Regular updates ensure that the analysis remains relevant and reflects the latest political reality.
Want this UP analysis for your constituency?
Booth-level and panchayat-level election analytics for any of Uttar Pradesh's 403 assembly seats or 80 Lok Sabha seats — graded and mapped to a clear action plan.