
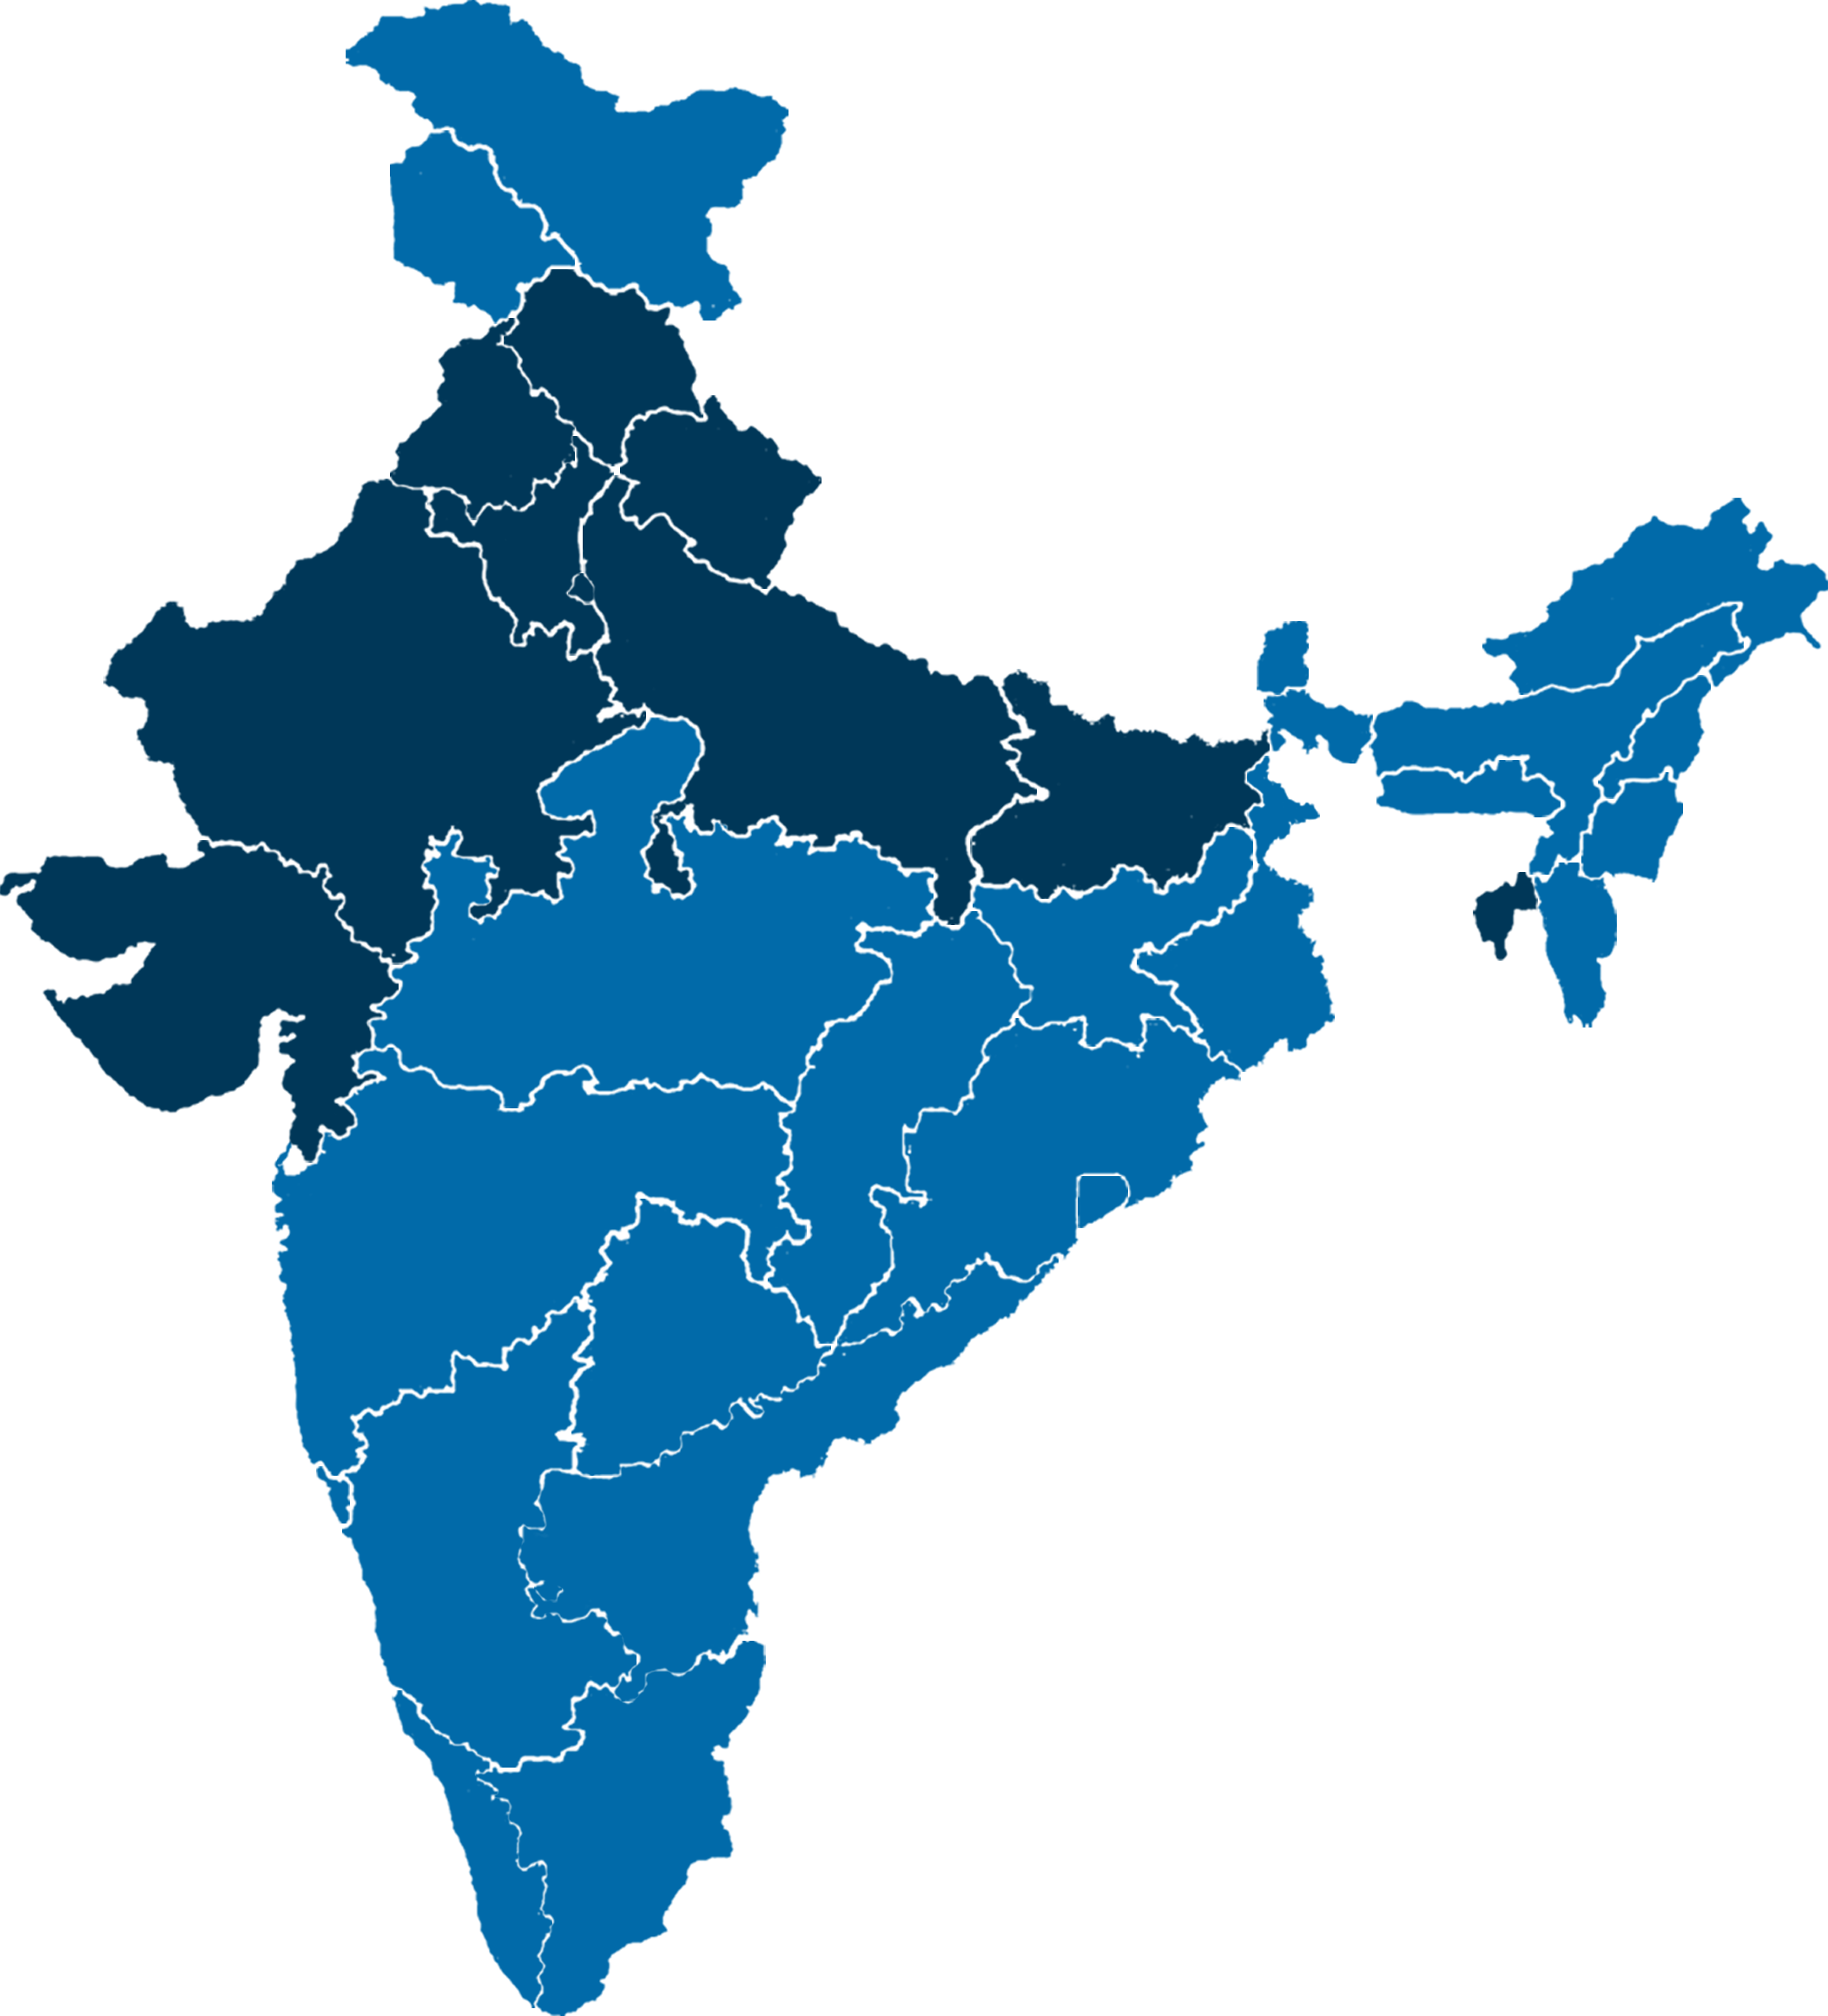

Uttar Pradesh Constituency Data Analysis Service
Explore comprehensive constituency-wise election research, historical Assembly results, candidate vote share, winning margins, voter turnout and booth-level electoral data through structured analysis by Click2Public Technologies.
Uttar Pradesh Constituency Data Analysis Service: Complete Overview
Uttar Pradesh Constituency Data Analysis Service focuses on collecting, organizing and examining election information at the Assembly constituency level. It brings together historical election results, candidate vote totals, political party performance, voter turnout and polling station records to create structured analytical reports.
Uttar Pradesh is India's most populous state and has 403 Legislative Assembly constituencies spread across 75 districts. Because of this large electoral structure, constituency-level research plays an important role in understanding the state's election results.
While statewide results provide a broad overview, constituency data offers more detailed information about local electoral outcomes. For example, researchers can examine candidate winning margins, changes in party vote share and historical election comparisons within individual Assembly constituencies.
Furthermore, structured election datasets make it easier to compare constituencies using consistent analytical indicators. Such comparisons are valuable for academic research, election journalism, public information and historical electoral studies.
At Click2Public Technologies, the focus is on presenting election research in an organized, understandable and evidence-based format.
What Does Constituency Data Analysis Include?
Assembly Election Results
Constituency-wise candidate results, party performance and winning margins.
Historical Election Comparison
Analysis of results across multiple election years.
Candidate Vote Share
Percentage of valid votes received by individual candidates.
Voter Turnout Analytics
Participation analysis using available official election records.
Booth-Wise Election Research
Polling station data organized within Assembly constituencies.
Election Data Visualization
Charts, tables and analytical reports presenting electoral information.
Why Constituency-Wise Election Data Analysis Matters in Uttar Pradesh
Constituency-wise election data analysis provides a detailed view of electoral outcomes across Uttar Pradesh.
Although statewide seat totals indicate which political parties have won elections, they do not fully explain differences between individual constituencies. Therefore, constituency-level research is essential for more detailed historical election reporting.
Understanding Local Election Results
Each Assembly constituency has its own candidate list, vote totals and winning margin. Analyzing these records provides a clearer picture of individual constituency outcomes.
Comparing Historical Elections
Historical analysis allows researchers to examine how results have changed between election years. In addition, party vote share and winning margins can be compared using consistent metrics.
Examining Electoral Participation
Voter turnout data helps researchers understand recorded participation across different constituencies.
Supporting Transparent Reporting
Structured datasets make official election information easier to review, compare and interpret.
Key Features of Our Uttar Pradesh Constituency Data Analysis Service
A comprehensive constituency data analysis service combines multiple electoral indicators into one structured research framework.
Constituency Profiles
Organized records containing constituency names, numbers, districts and historical election information.
Candidate-Wise Results
Election results organized by candidate, party, total votes and vote share.
Party Performance Reports
Historical comparisons of party results across Assembly constituencies.
Winning Margin Analysis
Comparison of vote differences between leading candidates.
Voter Turnout Reports
Analysis of electoral participation using official turnout information.
Historical Election Trends
Comparisons of constituency results across different Assembly election cycles.
Together, these features help organize complex election records into accessible research reports.
Uttar Pradesh Assembly Constituency-Wise Election Results Analysis
Assembly constituency election results provide the foundation for electoral data analysis in Uttar Pradesh. Each constituency elects one representative to the Legislative Assembly.
Official result records identify the contesting candidates, their political parties and the number of votes received.
Candidate-Wise Election Results
Candidate-wise analysis organizes vote totals for all contesting candidates within a constituency.
Winning Candidate Information
Election reports identify the winning candidate and political party for each constituency.
Winning Margin Comparison
The difference between the leading two candidates provides an important indicator of the recorded election result.
Party-Wise Constituency Results
Political party performance can be compared across different Assembly constituencies and election years.
Historical Uttar Pradesh Assembly Election Data Comparison
Historical election comparison is an important part of constituency data analysis.
Researchers can examine previous Uttar Pradesh Assembly elections to understand changes in seat distribution, party performance and constituency results.
| Election Year | Largest Party | Seats Won | Total Assembly Seats |
|---|---|---|---|
| 2007 | Bahujan Samaj Party (BSP) | 206 | 403 |
| 2012 | Samajwadi Party (SP) | 224 | 403 |
| 2017 | Bharatiya Janata Party (BJP) | 312 | 403 |
| 2022 | Bharatiya Janata Party (BJP) | 255 | 403 |
The table summarizes seats won by the largest individual party in each listed Assembly election, not alliance totals.
2007 Uttar Pradesh Assembly Election
The Bahujan Samaj Party won 206 seats in the 2007 election, securing a majority in the Legislative Assembly.
2012 Uttar Pradesh Assembly Election
The Samajwadi Party won 224 seats in 2012, forming a majority government.
2017 Uttar Pradesh Assembly Election
The Bharatiya Janata Party won 312 seats in the 2017 Assembly election.
2022 Uttar Pradesh Assembly Election
The BJP won 255 seats in the 2022 election, retaining a majority in the Legislative Assembly.
However, statewide seat totals are only one part of the picture. Constituency-wise data provides additional detail about candidate results and local winning margins.
Constituency-Wise Vote Share Analysis in Uttar Pradesh
Vote share represents the percentage of valid votes received by a candidate or political party.
It provides a standardized measure for comparing election results across constituencies with different numbers of votes.
For example, if a candidate receives 60,000 votes from 150,000 valid votes, the candidate's vote share is 40%.
Candidate Vote Share Comparison
Candidate vote share can be compared within a single constituency.
Party-Wise Vote Share
Party performance can be examined across constituencies using official candidate and party records.
Historical Vote Share Changes
Comparing election years helps document changes in recorded vote distribution.
Interpreting Vote Share Correctly
Vote share should be analyzed alongside turnout, candidate participation and other relevant electoral information.
Uttar Pradesh Constituency Winning Margin Analysis
Winning margin analysis examines the difference in votes between the winning candidate and the runner-up.
For example, if the winning candidate receives 90,000 votes and the runner-up receives 82,000 votes, the winning margin is 8,000 votes.
Close Election Results
Smaller winning margins indicate that the leading candidates finished with relatively similar vote totals.
Large Winning Margins
Larger margins indicate a greater difference between the two leading candidates.
Historical Margin Comparison
Comparing margins across election years helps document changes in constituency-level outcomes.
For meaningful comparisons, researchers should also consider total valid votes and turnout.
Uttar Pradesh Constituency-Wise Voter Turnout Analysis
Voter turnout is a key indicator of electoral participation within an Assembly constituency.
It measures the proportion of registered electors who cast their votes.
Constituency Turnout Reports
Turnout reports can compare participation across Assembly constituencies.
Historical Turnout Comparisons
Election-year comparisons help document changes in recorded participation.
Registered Elector Trends
Changes in registered elector totals should be considered when interpreting turnout.
Turnout Data Verification
Official turnout records should be used for reliable calculations.
Booth-Wise Election Data Analysis for UP Assembly Constituencies
Booth-wise election data provides additional detail within individual Assembly constituencies.
While constituency totals summarize the overall election result, polling station records can show how votes were distributed across booths.
Polling Station Vote Totals
Official booth-level records may contain candidate-wise vote totals.
Booth-Wise Turnout
Where suitable data is available, participation can be compared across polling stations.
Constituency Aggregation
Polling station records can be organized into constituency-level summaries.
Historical Booth Comparisons
Historical comparisons require careful matching because polling stations may be renumbered or reorganized.
District-Wise Uttar Pradesh Constituency Data Analysis
Uttar Pradesh contains 75 districts, each with one or more Assembly constituencies.
District-wise research helps organize constituency election information by administrative area.
Lucknow
Constituency-wise election results, candidate vote share and historical comparisons.
Kanpur Nagar
Assembly election results, winning margins and turnout analysis.
Varanasi
Historical constituency election records and party performance comparisons.
Agra
Constituency-level vote share analysis and election result reporting.
Meerut
Candidate-wise election results and historical constituency analytics.
Prayagraj
Constituency data research, turnout comparisons and election reporting.
Gorakhpur
Historical Assembly election data and candidate result analysis.
Ghaziabad
Constituency election data organization and comparative electoral research.
Similar research methods can be applied across the remaining districts of Uttar Pradesh.
Region-Wise Uttar Pradesh Assembly Election Data Analysis
Regional election research helps organize constituency results across broader geographical areas.
Western Uttar Pradesh
Research can examine Assembly constituency results across districts such as Meerut, Saharanpur, Muzaffarnagar and Ghaziabad.
Central Uttar Pradesh
Constituency comparisons may cover Lucknow, Kanpur and nearby districts.
Eastern Uttar Pradesh
Historical election research can include constituencies in Varanasi, Gorakhpur, Azamgarh and surrounding areas.
Bundelkhand Region
Regional analysis may examine constituencies across Jhansi, Banda, Chitrakoot and neighboring districts.
Regional groupings are useful for reporting, but official constituency and district boundaries should remain the primary reference.
Candidate-Wise Constituency Election Data Analysis
Candidate-wise election data is essential for understanding individual constituency results.
A structured candidate report can include candidate names, political parties, total votes, vote share and final positions.
Winning Candidate Analysis
The winning candidate's votes and margin provide a summary of the result.
Runner-Up Performance
Runner-up data helps document the difference between the leading candidates.
Multi-Candidate Comparisons
Where several candidates contest an election, vote share analysis helps present the complete result.
Historical Candidate Records
Historical research can compare candidate results across election cycles where records are available.
Important Metrics Used in UP Constituency Election Analytics
| Election Metric | Purpose |
|---|---|
| Candidate Votes | Records votes received by each candidate |
| Candidate Vote Share | Measures percentage of valid votes received |
| Winning Margin | Shows difference between winner and runner-up |
| Voter Turnout | Measures electoral participation |
| Registered Electors | Records eligible registered voters |
| Party Performance | Compares party results across constituencies |
| Historical Change | Documents changes between election years |
| Data Completeness | Checks availability of required election records |
These indicators provide a consistent framework for comparing electoral information across Assembly constituencies.
Our Methodology for Uttar Pradesh Constituency Data Analysis
A reliable constituency analysis report requires a structured research process.
Step 1: Collect Official Election Data
Gather constituency-level election results from relevant official sources, including the Election Commission of India.
Step 2: Organize Constituency Records
Standardize constituency names, numbers, districts and election years.
Step 3: Verify Candidate Information
Check candidate names, party affiliations and vote totals against official records.
Step 4: Calculate Election Metrics
Calculate vote share, winning margins and other analytical indicators using consistent formulas.
Step 5: Compare Historical Results
Examine constituency results across election cycles where records are comparable.
Step 6: Validate the Dataset
Review totals, identify missing records and document discrepancies.
Step 7: Prepare the Report
Present findings using clear tables, charts and explanatory summaries.
Explore Our Assembly Election Data Analysis Report
Discover more about Assembly election results, historical comparisons, constituency research and electoral analytics.
View Assembly Data Analysis ReportData Accuracy and Challenges in Constituency Election Research
Accurate constituency data analysis depends on reliable sources and careful validation.
Historical Boundary Changes
Constituency boundaries may change after delimitation. Therefore, historical comparisons must account for relevant boundary differences.
Candidate and Party Changes
Candidates may contest different elections under different party affiliations. As a result, candidate and party comparisons should be treated separately.
Incomplete Historical Records
Some older election records may not be available in the same digital format as more recent results.
Data Entry Verification
Manual data collection can introduce errors. Consequently, totals should be checked against official publications.
Responsible Data Interpretation
Aggregate constituency results do not reveal how individual voters cast their ballots.
Constituency Election Data Visualization and Analytical Reports
Election data visualization makes complex information easier to understand.
Vote Share Comparison Charts
Charts can compare candidate or party vote share across election years.
Winning Margin Tables
Tables can summarize differences between winning candidates and runners-up.
Historical Result Dashboards
Dashboards can organize multiple election years into a consistent analytical format.
District and Region Summaries
Aggregated reports can present constituency results by district or geographical region.
Who Can Benefit from Uttar Pradesh Constituency Data Analysis?
Election Researchers
Study historical constituency results and electoral participation.
Academic Institutions
Use structured election records for political science and public policy research.
Election Journalists
Prepare evidence-based constituency reports and historical comparisons.
Data Analysts
Develop charts, tables and dashboards using verified electoral datasets.
Public Policy Researchers
Examine aggregate electoral participation and historical election outcomes.
Public Information Platforms
Present official election results in accessible formats.
Why Choose Click2Public for Uttar Pradesh Constituency Data Analysis Service?
Click2Public Technologies focuses on structured election research, historical data comparison and constituency-level analytical reporting.
The objective is to make complex electoral information more accessible through organized datasets and clear explanations.
Constituency-Focused Research
Election information can be organized around individual Assembly constituencies.
Historical Election Comparisons
Previous election results can be examined to document changes in recorded outcomes.
Structured Data Reporting
Consistent tables and analytical formats help present electoral information more clearly.
Vote Share and Margin Analysis
Candidate vote percentages and winning margins provide useful comparative indicators.
Evidence-Based Research
Official sources, data validation and transparent methodology support reliable election analysis.
FAQs About Uttar Pradesh Constituency Data Analysis Service
What is Uttar Pradesh Constituency Data Analysis Service?
It is the structured analysis of constituency-wise election results, candidate votes, vote share, turnout, winning margins and historical electoral data.
How many Assembly constituencies are there in Uttar Pradesh?
Uttar Pradesh has 403 Legislative Assembly constituencies.
What information is included in a constituency election report?
A report may include candidate names, party affiliations, votes received, winning margins, turnout and historical comparisons.
How is constituency vote share calculated?
Candidate vote share is calculated by dividing the candidate's votes by total valid votes and multiplying by 100.
Can previous Assembly election results be compared?
Yes. Historical constituency results can be compared when reliable records are available and boundary changes are considered.
What is the difference between constituency and booth-level data?
Constituency data summarizes an entire electoral area, while booth-level data provides more detailed results from individual polling stations.
Where can official Uttar Pradesh election results be found?
Official election information is available through the Election Commission of India and relevant election authorities.
Why is historical constituency data analysis important?
Historical analysis helps researchers understand changes in election results, party performance, turnout and winning margins across election cycles.
Understanding UP Elections Through Constituency Data Analysis
Uttar Pradesh Constituency Data Analysis Service provides a structured approach to understanding Assembly election results, historical vote share, winning margins, voter turnout and candidate performance.
By organizing constituency-wise election information, researchers can examine electoral outcomes at a more detailed level than statewide summaries alone.
Furthermore, historical comparisons help document changes in constituency results when consistent records are available.
However, reliable analysis depends on official election data, transparent methodology and careful interpretation.
Click2Public Technologies focuses on organized electoral research and analytical reporting to make election information more accessible and understandable.
Explore Assembly Data Analysis Report