
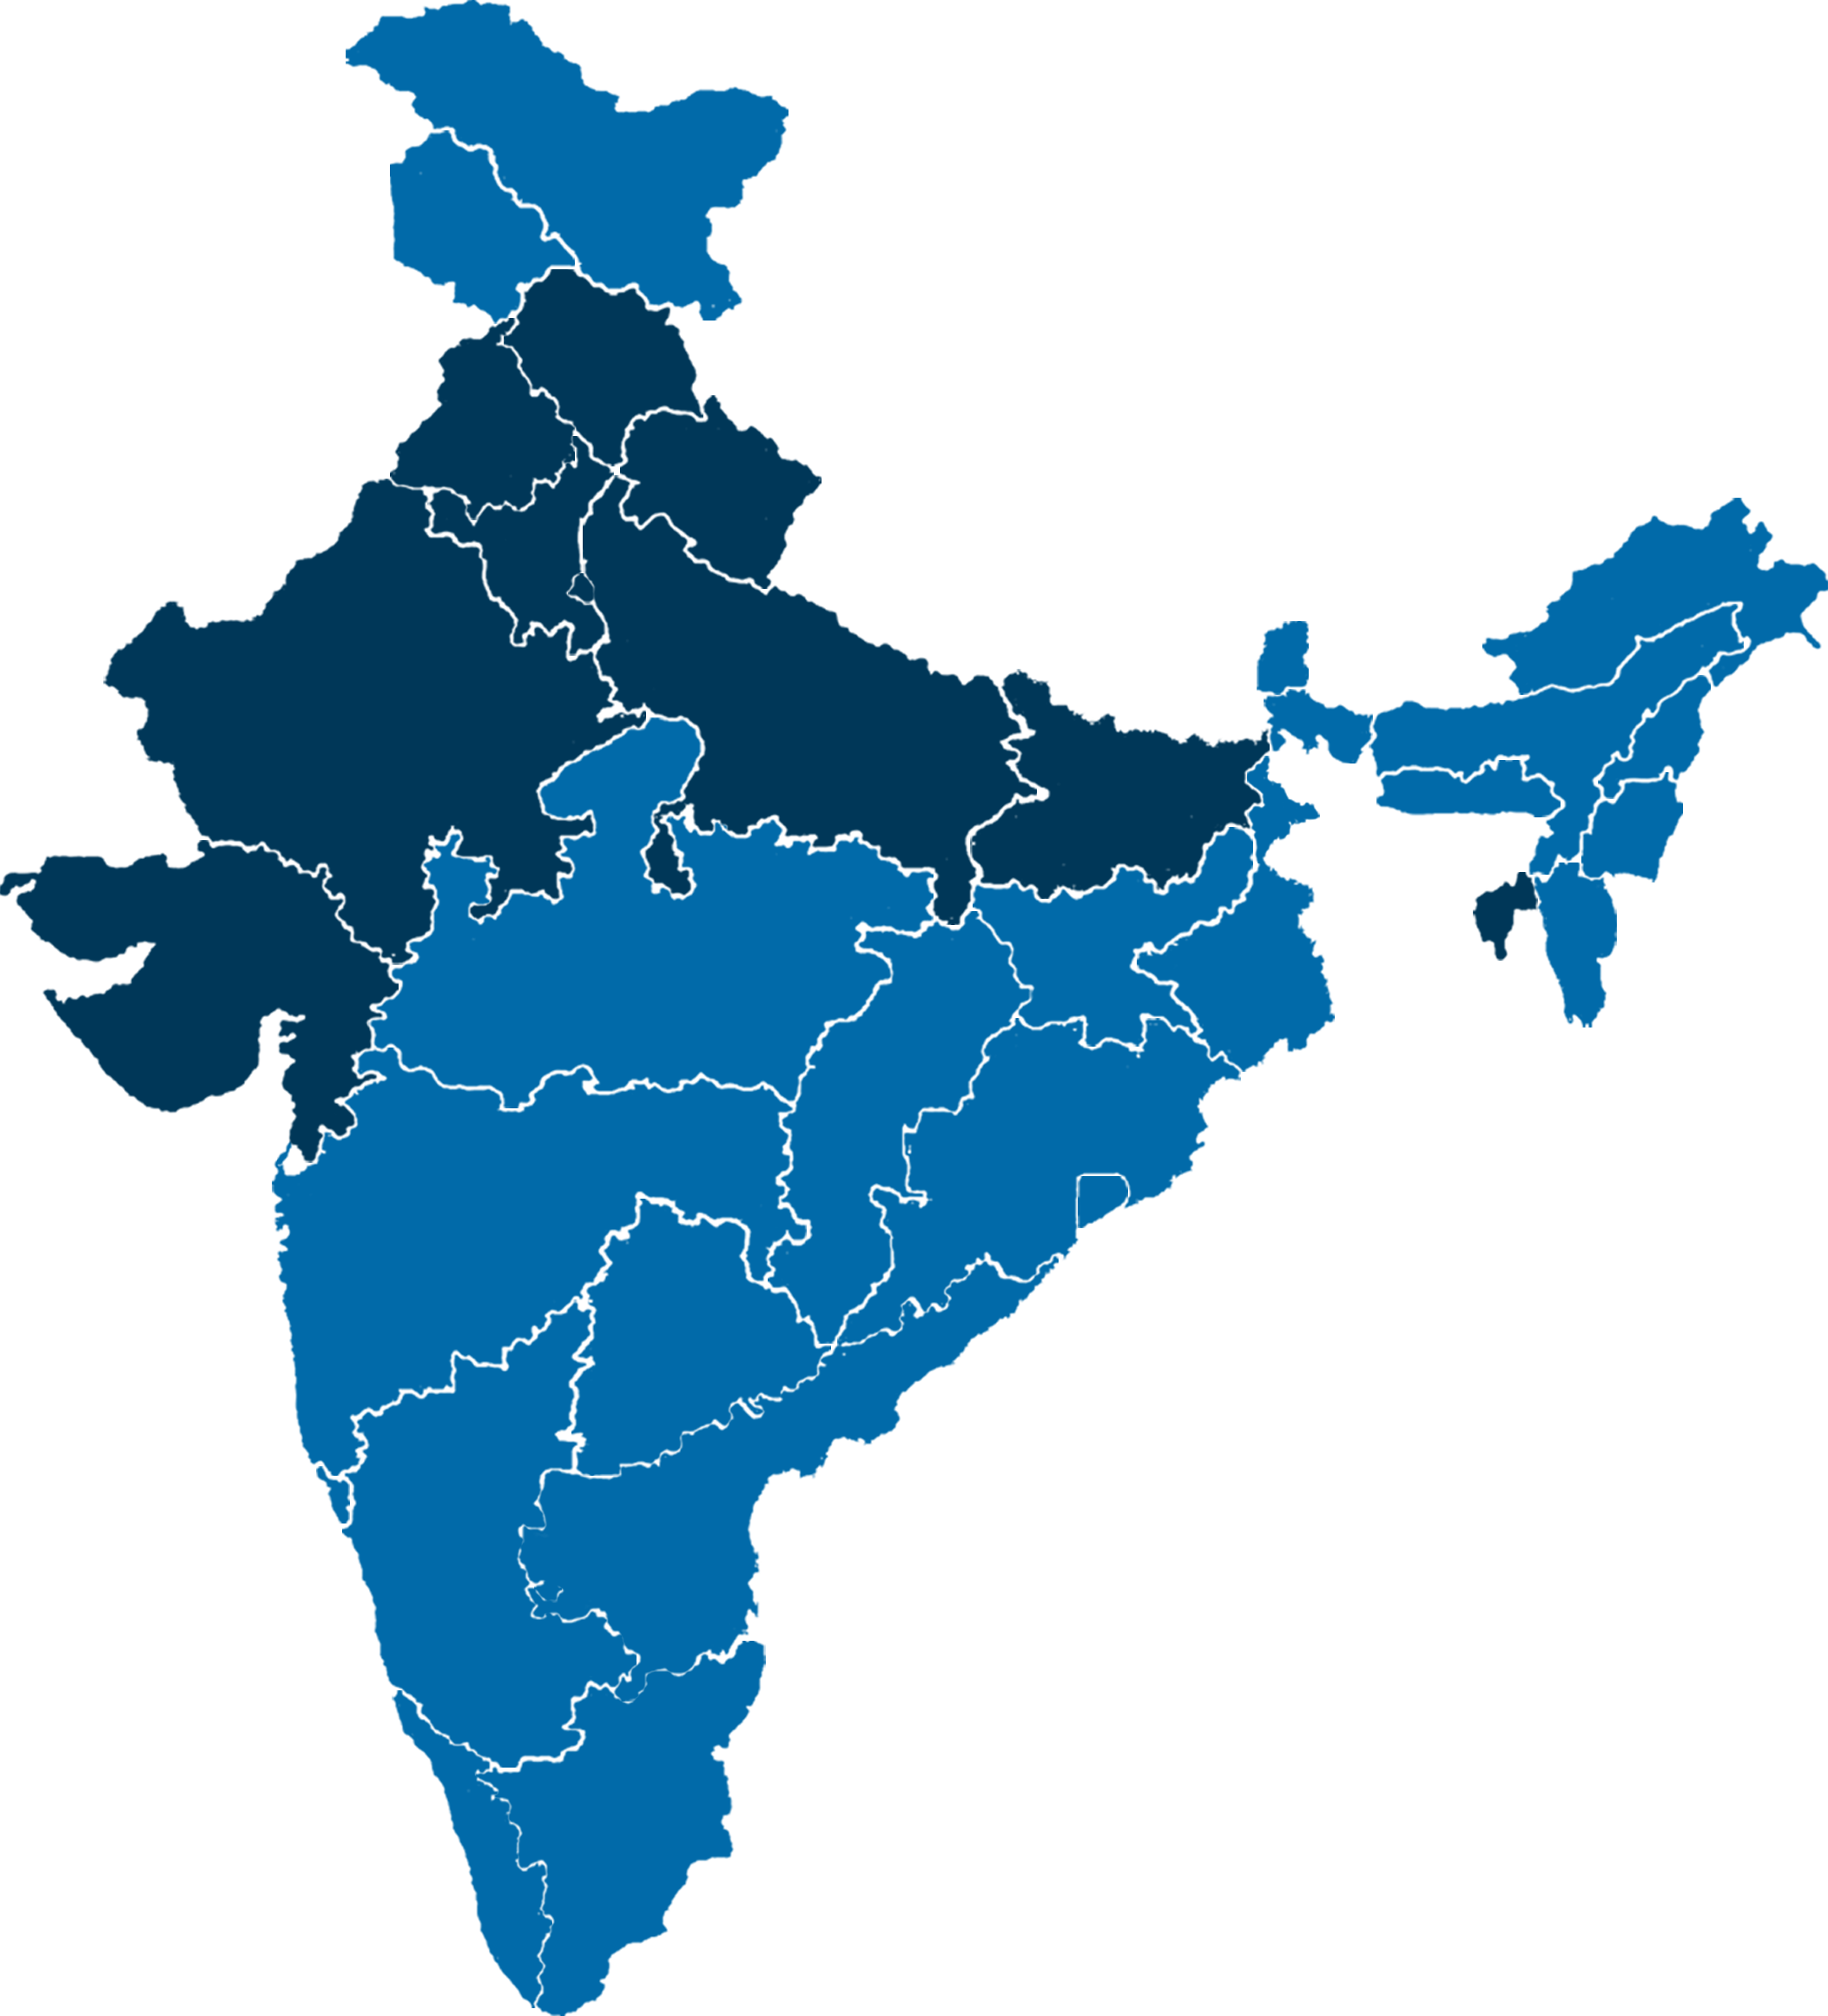

Uttar Pradesh Booth Wise Election Result Analysis: The Ultimate 2027 Guide
Discover how to map every polling booth, identify swing voters, grade booth performance, and build a targeted ground-level strategy to win the 2027 elections.
The Booth is the Real Battleground
Understanding Uttar Pradesh Booth Wise Election Result Analysis
An Uttar Pradesh Booth Wise Election Result Analysis is the most critical tool for any serious political campaign. While state and district-level data provide a macro view, the real story is written at the 1.6 lakh polling booths across the state. By analyzing how different booths voted in 2017, 2019, 2022, and 2024, parties can identify exact clusters of swing voters, loyal voters, and opposition strongholds.
This detailed Uttar Pradesh Booth Wise Election Result Analysis requires mapping demographic data, caste equations, and historical voting patterns at a micro-level. It allows campaign managers to distribute resources, deploy workers, and focus on the Grade B and Grade C booths that actually decide close elections.
For historical booth data, analysts often reference the Election Commission of India and cross-reference with demographic data from sources like Wikipedia.
To build a professional Uttar Pradesh Booth Wise Election Result Analysis, you can explore data services at Click2Public or read our detailed Assembly Data Analysis Reports.

In Indian politics, especially in a state as massive as Uttar Pradesh, elections are not won at the state headquarters. They are won booth by booth. With over 1.6 lakh polling booths, an Uttar Pradesh Booth Wise Election Result Analysis is the only way to decode the true political DNA of a constituency.
A constituency might appear to be a safe seat based on overall vote share. But a booth-wise deep dive often reveals that the margin of victory came from just 15-20 specific booths. If those booths shift in the next election, the seat flips.
In this comprehensive guide, we will break down exactly how a booth-wise analysis works. We will cover how to collect data, grade booths, analyze caste math at the ground level, track turnout differentials, and use this data to construct a winning strategy for the 2027 Assembly elections.
What Is a Booth Wise Result Analysis?
A granular, street-level breakdown of how people actually voted.
An Uttar Pradesh Booth Wise Election Result Analysis is a forensic examination of voting data at the polling booth level. While a constituency report tells you who won, a booth-wise analysis tells you exactly how they won and where the other party lost.
Each polling booth contains roughly 1,000 to 1,200 voters. Because booths are geographically drawn, they usually correspond to a specific village, a colony, or a neighborhood. This means each booth has a distinct social and caste composition. When you analyze booth-level data across multiple elections, you can spot precise trends.
Micro-Level Targeting
Instead of guessing which issues matter to a town, booth analysis tells you that Booth #45 wants better roads, while Booth #46 is angry about unemployment. It allows a campaign to tailor its message block by block.
Identifying Swing Voters
By comparing 2022 and 2024 results, you can identify booths that shifted heavily. These are not loyal voters; they are persuadable voters. They hold the key to future victories.
The Data Collection Process
Where does the data for a booth-wise analysis come from?
A high-quality Uttar Pradesh Booth Wise Election Result Analysis relies on three distinct layers of data:
- Historical ECI Data: Form 20 is the official document published by the Election Commission of India after every election. It provides the exact number of votes polled by each candidate at every single booth. Analysts digitize this raw data to create a historical baseline.
- Demographic Mapping: Raw voting data is useless without context. Analysts map the location of every booth against census data, local village maps, and ground reports to determine the caste, religion, and primary occupation (e.g., farming, weaving, daily wage) of the voters in that booth.
- Ground Intelligence: Data on a spreadsheet doesn't tell you about local disputes. A good report includes qualitative feedback from local party workers and village heads (Pradhans). If a booth shifted heavily to the opposition, ground intelligence explains *why*—perhaps a local candidate was arrested, or a factory closed down.
Combining macro ECI data with hyper-local demographic and ground intelligence is what transforms a basic spreadsheet into a weapon for the 2027 elections. If you want to see how this data is structured on a larger scale, you can explore our detailed Assembly Data Analysis Reports.
The A to D Booth Grading System
How data analysts categorize the 1.6 lakh polling booths in UP.
To make sense of thousands of booths, analysts grade them from A to D based on historical performance. Here is how a Uttar Pradesh Booth Wise Election Result Analysis categorizes them:
| Grade | Definition | Winning Strategy |
|---|---|---|
| Grade A (Hold) | Party consistently wins with a massive margin (60%+ vote share). | Maintain presence. Ensure your core voters don't stay home. Do not waste extra funds here. |
| Grade B (Defend) | Party wins, but margin is narrow (45-55%). | Targeted outreach. Identify local grievances and resolve them before they cause slippage. |
| Grade C (Swing) | Party is slightly behind or the booth historically flips between parties. | High investment. Deploy star campaigners. Address specific community demands to win back. |
| Grade D (Opposition) | Opposition dominates. Margin is too large to flip in one cycle. | Do not waste resources. Focus on long-term demographic changes or wait for an anti-incumbency wave. |
When you look at a Uttar Pradesh Booth Wise Election Result Analysis, the election is won or lost in the Grade B and Grade C booths. If a party can flip just 10% of the swing booths in a constituency, it is usually enough to win the seat.
Caste Math at the Booth Level
Demographics are not just district-wide; they change from street to street.
Uttar Pradesh is a mosaic of castes. While macro-level reports talk about Yadavs, Dalits, or Jats in general terms, a Uttar Pradesh Booth Wise Election Result Analysis maps caste to specific polling stations.
For example, a village might be 80% Yadav, meaning its booth is an SP stronghold. But the next booth, just two kilometers away, might be a mixed colony of Dalits and Brahmins. Historically, this booth might have swung wildly between the BSP and the BJP.
By overlaying booth locations with census and local demographic data, a campaign can see exactly where the opposition's vote bank is concentrated. This allows for surgical messaging. If a Grade C booth has a high population of non-Jatav Dalits, a party can tailor its welfare schemes specifically to that sub-caste to peel them away from the opponent.
Election Day: GOTV & Turnout
If your voters stay home, you lose. Get-Out-The-Vote is a science.
High vote share means nothing if your voters don't show up. A detailed Uttar Pradesh Booth Wise Election Result Analysis tracks the turnout percentage alongside the vote share.
You might find that a booth has 60% support for your party, but only 40% of people actually cast their vote there. Meanwhile, the opposition booth next door has 50% support, but an 80% turnout rate. The opposition wins that area purely through enthusiasm.
This data is the core of GOTV (Get-Out-The-Vote) operations. If a booth shows historically low turnout among your core demographic (e.g., young voters, or a specific caste), the campaign knows to deploy extra polling agents, arrange transport, or run localized awareness drives on election day.
A booth-wise strategy also divides workers into specific roles: Booth Level Agents (BLAs) who sit inside the polling station to track who has voted, and Panna Pramukhs (page in-charge) who manage a list of 30-50 voters to ensure they reach the booth. Without a booth-wise report, deploying these workers is pure guesswork.
Need a Booth-Wise Analysis for Your Seat?
Get a detailed, data-driven map of every polling booth in your constituency, complete with A-to-D grading, caste math, and GOTV strategy.
Case Study: Flipping a Swing Seat
How booth data turns a losing seat into a winning blueprint.
Imagine a hypothetical constituency where Party A lost by 5,000 votes in 2022. A Uttar Pradesh Booth Wise Election Result Analysis is conducted for Party A to plan for 2027.
The constituency has 350 polling booths.
Party A lost 60 booths that it had won in 2017.
Data shows the 60 lost booths are dominated by farmers angry about canal water supply.
Because of the booth analysis, Party A knows exactly what to do. Instead of spending money on a statewide advertising campaign, they focus entirely on the 60 Grade C booths. They hold local meetings, promise to fix the canal issue, and deploy 10 workers per booth to ensure their voters turn out on election day.
By flipping those 60 booths, Party A doesn't just recover their lost 5,000 votes; they win the seat by a comfortable margin. This is the raw power of a targeted Uttar Pradesh Booth Wise Election Result Analysis.
Booth Analysis FAQs
What is Uttar Pradesh Booth Wise Election Result Analysis?
It is a granular breakdown of voting data at the polling booth level, helping parties understand exactly where they won or lost votes within a specific constituency, down to the neighborhood or village level.
How many polling booths are there in UP?
Uttar Pradesh has over 1.6 lakh polling booths spread across 403 assembly constituencies, making booth-level data analysis the most critical tool for any campaign.
What is the A to D Booth Grading system?
Booths are graded based on historical performance. Grade A are strongholds, Grade B are leaners, Grade C are swing booths that decide elections, and Grade D are opposition strongholds.
Why is GOTV (Get-Out-The-Vote) important in UP elections?
High vote share means nothing if voters stay home. GOTV focuses on ensuring core voters actually cast their ballots, especially in booths with historically low turnout.
Get Your Booth-Wise Report Today
Booth-level and panchayat-level election analytics for any of Uttar Pradesh's 403 assembly seats — graded and mapped to a clear action plan.