
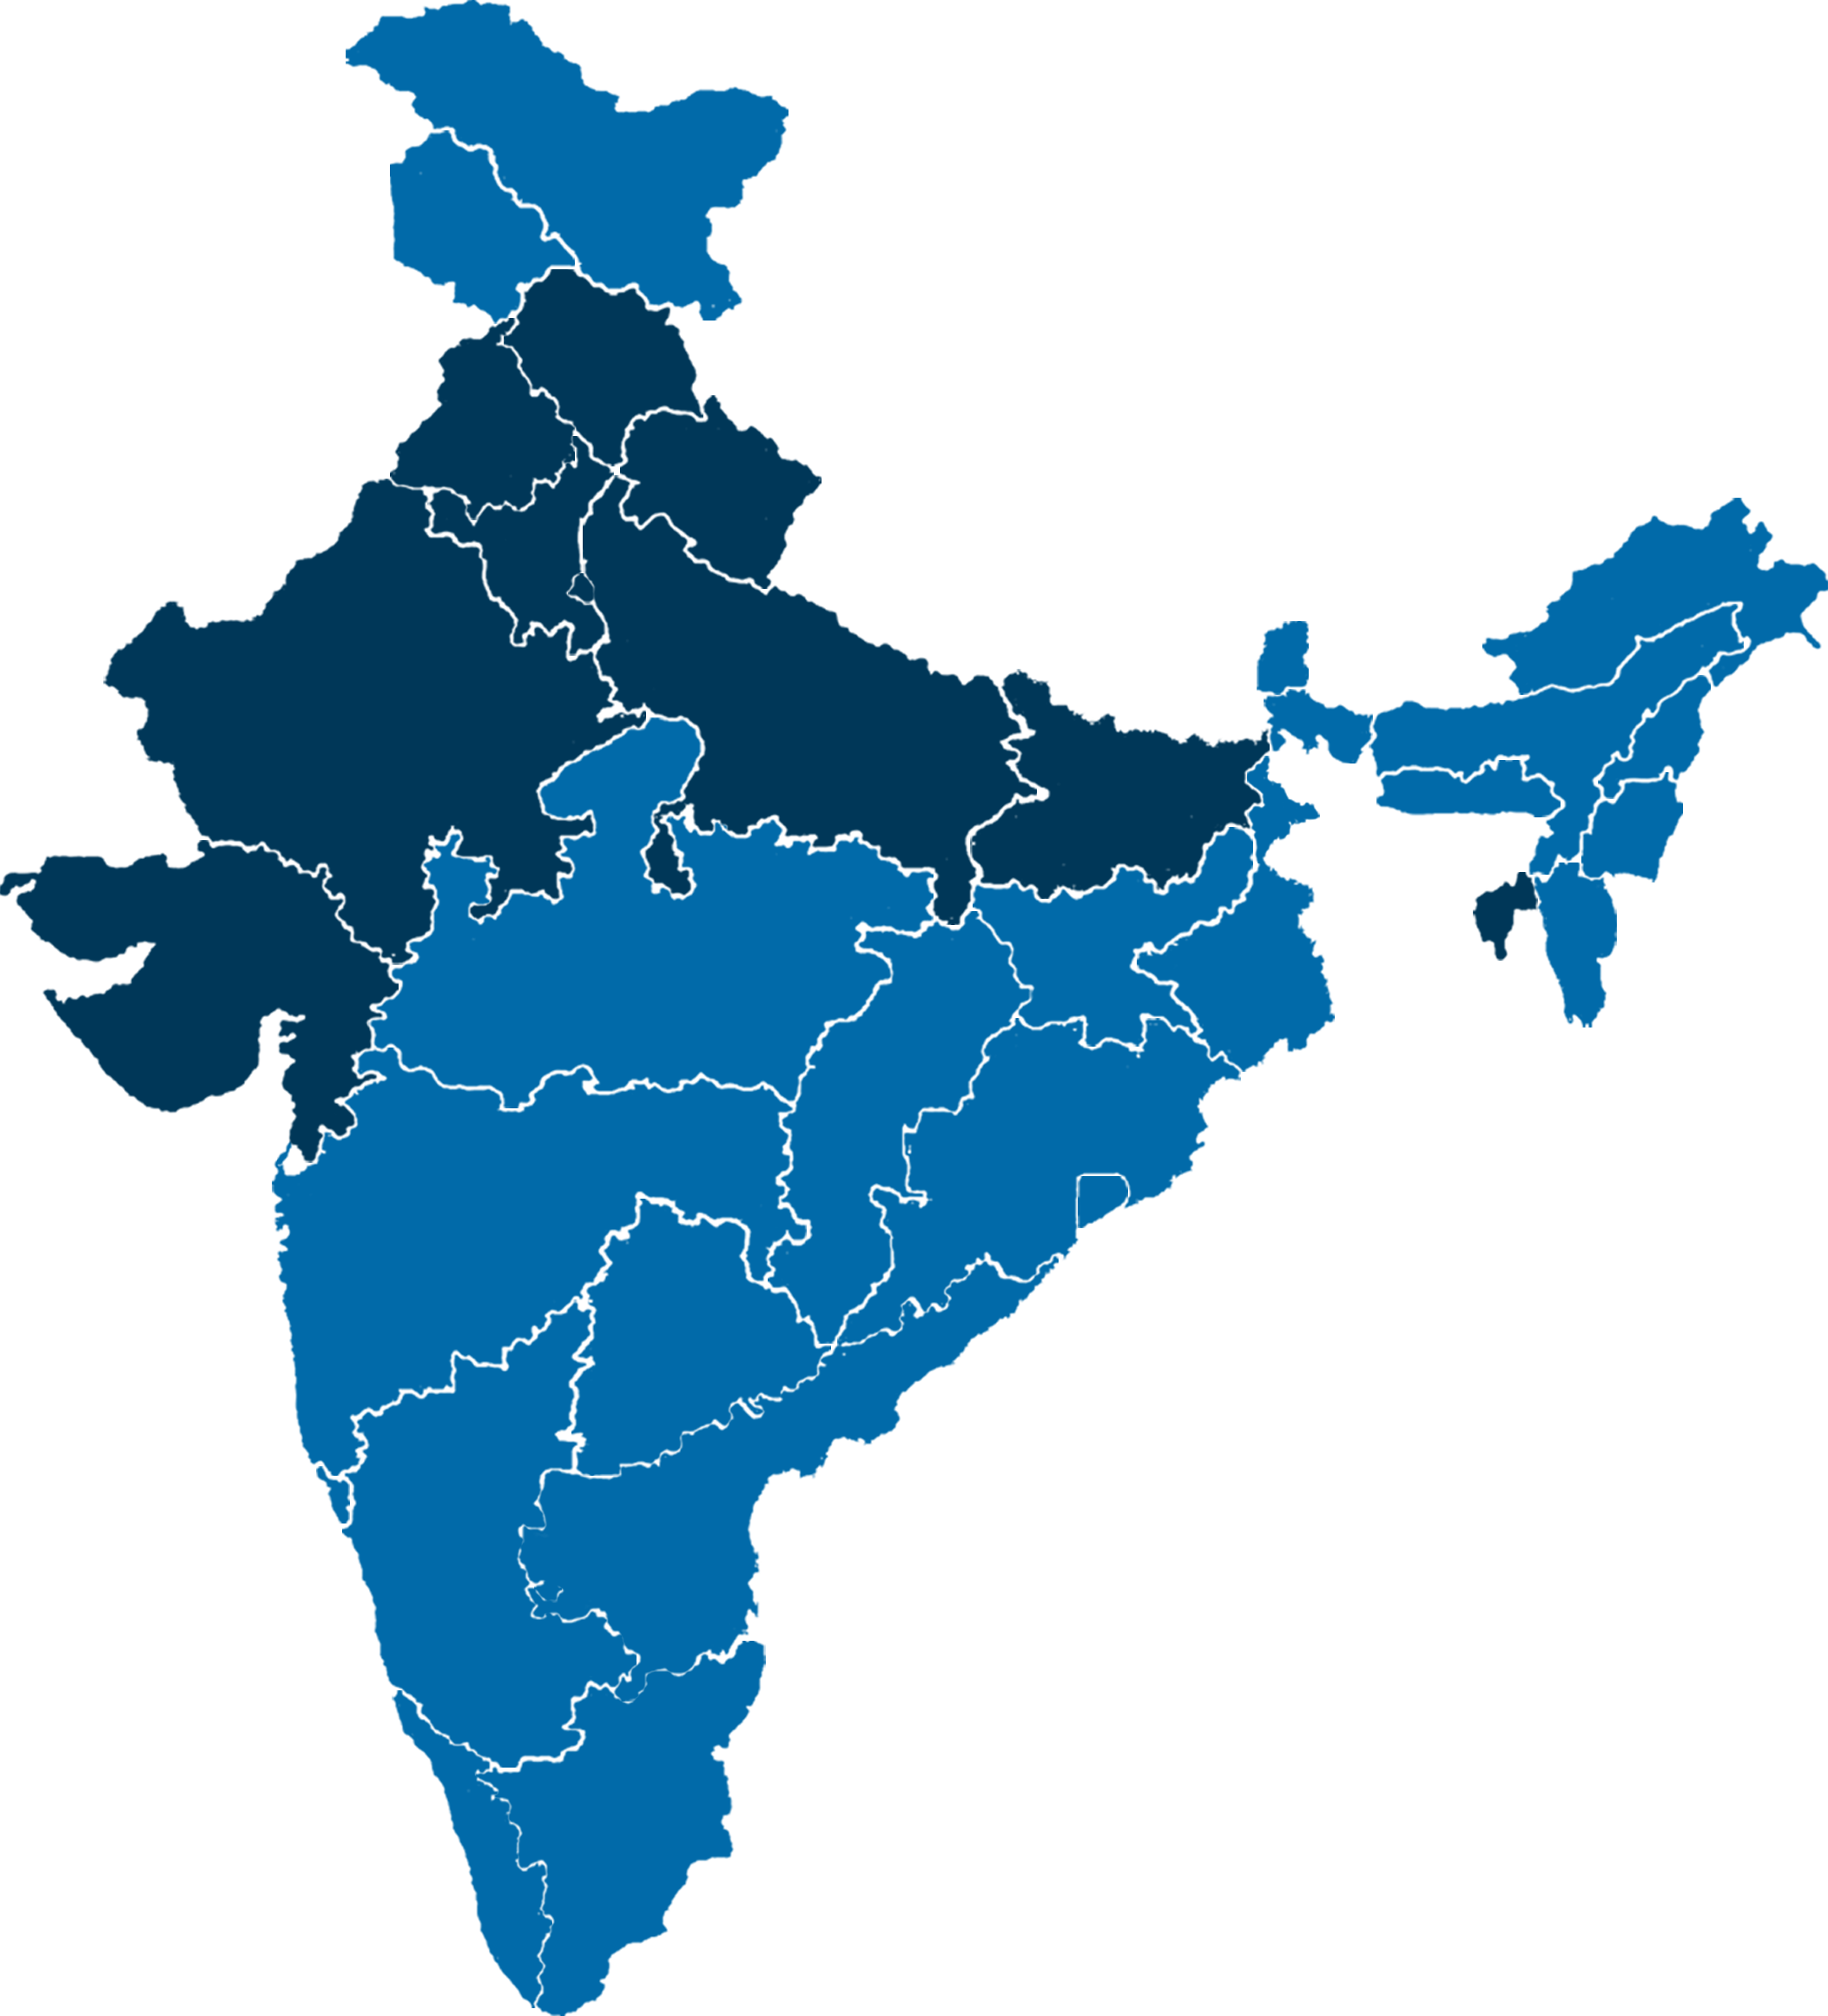

Uttar Pradesh Constituency Wise Vote Share Analysis
A comprehensive guide to Uttar Pradesh election results, Assembly and Lok Sabha constituencies, party vote share, historical voting trends, polling station analysis, Form 20 records and constituency-level electoral research.
Illustrative chart only. Values do not represent actual election results.
Understanding Uttar Pradesh Constituency Wise Vote Share Analysis
A detailed approach to understanding electoral performance across Uttar Pradesh.
Uttar Pradesh Constituency Wise Vote Share Analysis is the systematic examination of votes received by political parties and candidates across individual Assembly and Lok Sabha constituencies. It helps researchers understand how electoral support varies between constituencies, elections and geographic regions.
Uttar Pradesh is India's most populous state and has a major role in national politics. With 403 Assembly constituencies and 80 Lok Sabha constituencies, the state offers an extensive electoral landscape. Each constituency has its own population distribution, geographic characteristics, candidate choices and voter participation patterns.
Statewide election results provide an overview of party performance. However, a statewide percentage cannot explain every constituency's outcome. Constituency-wise analysis examines the votes received within each seat and shows how those results contribute to the larger electoral picture.
For example, two candidates may win their respective constituencies but receive different percentages of the total valid votes. Similarly, a party may receive a substantial vote share in a constituency without winning the seat. Therefore, vote share and seat share must be examined separately.
At Click2Public Technologies, election research focuses on organizing historical results, comparing constituency-level performance and presenting electoral data through structured reports. Accurate information and transparent calculations are essential for meaningful analysis.
What Does Constituency Wise Vote Share Analysis Include?
- Assembly constituency-wise election results
- Lok Sabha constituency-wise vote share
- Political party performance comparisons
- Candidate-wise votes and percentages
- Historical election trend analysis
- Winning margin and runner-up analysis
- Polling booth-wise voting information
- Voter turnout and participation research
- Form 20 election result interpretation
- Data visualization and constituency reports
Why Constituency Wise Vote Share Analysis Is Important
Understanding the value of detailed electoral research.
Constituency-wise election analysis helps explain the relationship between votes received and election outcomes. Rather than relying only on statewide figures, researchers can examine how political parties perform in individual seats.
A party may have a strong statewide vote share but win fewer seats than another party. This can happen because votes are distributed differently across constituencies. Understanding this difference is essential when interpreting election results.
Party Vote Share Analysis
Compare the percentage of valid votes received by political parties across constituencies.
Historical Election Trends
Examine changes in electoral performance between different election years.
Voter Turnout Research
Study constituency-level participation and differences in voter turnout.
Election Result Reporting
Prepare structured reports using verified candidate-wise and constituency-wise data.
Understanding Vote Share and Seat Share
Vote share measures the proportion of votes received. Seat share measures the proportion of constituencies won. These two indicators describe different aspects of electoral performance.
In a first-past-the-post electoral system, the candidate receiving the highest number of votes in a constituency wins that seat. Consequently, a party's total seats may not be proportional to its statewide vote share.
Why Local-Level Comparisons Matter
Uttar Pradesh contains large metropolitan areas, industrial centres, agricultural regions and smaller towns. Constituency-level results can vary across these locations.
A detailed report helps researchers identify these measurable differences while avoiding unsupported assumptions about the reasons behind individual voting decisions.
Uttar Pradesh's 403 Assembly and 80 Lok Sabha Constituencies
Understanding the structure of the state's electoral geography.
Uttar Pradesh has 403 elected Assembly seats. These constituencies elect representatives to the Uttar Pradesh Legislative Assembly. The state also has 80 Lok Sabha constituencies, which elect members to India's lower house of Parliament.
A complete Uttar Pradesh Constituency Wise Vote Share Analysis should identify the correct election type before comparing results. Assembly and parliamentary constituencies are different electoral units.
| Election Type | Constituencies | Representative | Research Focus |
|---|---|---|---|
| UP Assembly | 403 | MLA | Assembly constituency vote share |
| Lok Sabha | 80 | MP | Parliamentary constituency vote share |
Assembly Constituency Vote Share Analysis
Assembly constituency analysis examines candidate-wise votes, party performance, valid votes and winning margins in each Assembly seat. It can also compare results from previous Assembly elections.
Researchers may study constituencies such as Lucknow Central, Agra North, Varanasi North, Meerut, Kanpur Cantonment and other seats using official election result records.
Lok Sabha Constituency Vote Share Analysis
Lok Sabha constituency analysis focuses on parliamentary election results. It examines the votes received by candidates and the percentage of valid votes they secured.
Constituencies such as Lucknow, Varanasi, Agra, Kanpur, Meerut, Gorakhpur, Prayagraj and Ghaziabad can be studied individually through official parliamentary election data.
When comparing parliamentary and Assembly elections, researchers should clearly distinguish the two election types and their geographic boundaries.
How to Calculate Constituency Wise Vote Share
Understanding the mathematical foundation of election analysis.
Vote share is calculated by dividing the votes received by a candidate or party by the appropriate total number of valid votes, then multiplying the result by 100.
Example of Constituency Vote Share Calculation
Consider a hypothetical constituency where three candidates receive different numbers of votes. The following figures are illustrative and do not represent actual Uttar Pradesh election results.
| Candidate | Votes Received | Vote Share |
|---|---|---|
| Candidate A | 50,000 | 50% |
| Candidate B | 35,000 | 35% |
| Candidate C | 15,000 | 15% |
| Total | 100,000 | 100% |
In this example, Candidate A receives 50% of the valid votes and leads Candidate B by 15,000 votes. This illustrates the difference between vote share and the absolute winning margin.
How to Calculate Winning Margin
The winning margin is the difference between the number of votes received by the winning candidate and the runner-up.
Understanding Percentage-Point Change
When comparing vote share between elections, the difference is usually expressed in percentage points.
For example, if a party's vote share changes from 35% to 40%, that represents an increase of five percentage points.
Historical Uttar Pradesh Election Vote Share Trends
Comparing electoral performance across different election years.
Historical election research is an important part of Uttar Pradesh Constituency Wise Vote Share Analysis. Comparing results across election years helps researchers understand changes in candidate performance, political party vote share and electoral participation.
| Election Year | Election Type | Analysis Focus |
|---|---|---|
| 2017 | UP Assembly | Historical Assembly performance |
| 2019 | Lok Sabha | Parliamentary election results |
| 2022 | UP Assembly | Recent Assembly vote share |
| 2024 | Lok Sabha | Recent parliamentary vote share |
2017 Uttar Pradesh Assembly Election
The 2017 Assembly election provides an important historical reference for studying constituency performance. Researchers can examine party vote shares, candidate margins and seat outcomes using official results.
2019 Lok Sabha Election
The 2019 parliamentary election offers another dataset for understanding party performance across Uttar Pradesh's Lok Sabha constituencies.
However, parliamentary results should not be treated as direct substitutes for Assembly election results.
2022 Uttar Pradesh Assembly Election
The 2022 Assembly election provides a more recent reference for evaluating candidate and party performance across 403 Assembly constituencies.
Constituency-wise analysis can examine how vote shares and winning margins differed from the 2017 election.
2024 Lok Sabha Election
The 2024 Lok Sabha election provides recent parliamentary election data for Uttar Pradesh.
Researchers can compare constituency vote shares, party performance and participation with the 2019 parliamentary election using consistent methods.
Limitations of Historical Comparisons
Candidates, party alliances, turnout and other election conditions may change between election years. Therefore, a change in vote share does not prove that particular individuals changed their voting preferences.
Regional Vote Share Analysis Across Uttar Pradesh
Studying election results across the state's diverse regions.
Uttar Pradesh includes several regions with different economic, geographic and administrative characteristics. Regional grouping can make large constituency datasets easier to interpret.
Western Uttar Pradesh
Research constituencies around Meerut, Ghaziabad, Saharanpur, Muzaffarnagar, Agra and neighbouring districts.
Central Uttar Pradesh
Compare constituency results in Lucknow, Kanpur, Unnao, Barabanki and nearby areas.
Eastern Uttar Pradesh
Examine electoral data from Varanasi, Gorakhpur, Azamgarh, Jaunpur and surrounding districts.
Bundelkhand Region
Study election results in Jhansi, Banda, Chitrakoot, Mahoba and other constituencies.
Why Regional Comparisons Are Useful
Regional analysis helps researchers organize large numbers of constituencies into manageable groups. It also allows comparisons of turnout, candidate vote shares and election outcomes.
Nevertheless, regional averages can hide differences between individual constituencies. A complete report should include both regional summaries and seat-specific information.
Urban and Rural Constituency Comparisons
Urban and rural areas may differ in population density, polling station distribution and electoral participation. Researchers can examine these differences through official turnout and result records.
Such comparisons should be based on clearly defined geographic categories rather than assumptions about how residents vote.
Booth Wise and Constituency Wise Election Analysis
Understanding the relationship between polling stations and overall constituency results.
Every Assembly and Lok Sabha constituency contains polling stations where electors cast their votes. Booth-wise analysis examines results at this smaller geographic level.
Constituency-wise vote share analysis combines the relevant candidate vote totals to calculate overall percentages. Booth-wise analysis provides additional detail about how those totals are distributed.
What Can Booth-Level Data Show?
- Candidate votes recorded at polling stations
- Differences in candidate performance
- Polling station winning margins
- Distribution of votes within a constituency
- Historical polling station comparisons
- Turnout patterns when appropriate records are available
Combining Booth Data With Constituency Results
When official polling station records are available, researchers can aggregate the relevant votes and reconcile the totals with constituency-level results.
This process supports data verification and helps identify inconsistencies that may require further checking.
Challenges in Booth-Level Research
Polling station numbering and boundaries may change between elections. Consequently, direct comparisons require careful verification.
Researchers should also distinguish official results from estimated figures. Reliable reporting depends on clearly documented sources and methods.
Importance of Form 20 in Vote Share Analysis
Understanding official election result documentation.
Form 20 is an official final result sheet used in Indian elections. It contains candidate-wise vote information and is an important source for detailed election result research.
For Uttar Pradesh Constituency Wise Vote Share Analysis, relevant Form 20 records can support the verification of candidate vote totals and polling station results.
Information Used in Election Research
- Candidate-wise votes received
- Polling station result information
- Official constituency totals
- Data for vote-share calculations
- Information for election result comparisons
Why Official Data Matters
Election results may appear on multiple news and research websites. However, official election records should remain the primary reference for detailed numerical analysis.
Researchers should verify the election year, constituency and candidate details before using any figures in a report.
Official election results can be accessed through the Election Commission of India Results Portal .
How to Prepare an Uttar Pradesh Vote Share Analysis Report
A systematic approach to accurate election research.
Step 1: Identify the Election
Begin by selecting the election year and election type. Clearly identify whether the research concerns Assembly or Lok Sabha results.
Step 2: Collect Official Results
Collect candidate-wise vote totals, constituency information and relevant official result documents.
Step 3: Organize the Dataset
Create a structured dataset containing constituency names, candidate names, political parties, valid votes, vote totals and election years.
Step 4: Calculate Vote Share
Apply consistent vote-share formulas to every constituency. Use the same denominator definition throughout the report.
Step 5: Compare Historical Performance
Compare results across relevant election years while accounting for differences in candidates, alliances and electoral boundaries.
Step 6: Prepare Charts and Tables
Present verified results through constituency tables, vote-share charts, historical comparisons and clear summaries.
Step 7: Review Data Accuracy
Check calculations and reconcile published figures with official election records before completing the final report.
Why Choose Click2Public Technologies?
Structured election research and constituency-level data reporting.
Click2Public Technologies focuses on political research, constituency analysis and election data analytics across Uttar Pradesh and other regions of India.
Our approach emphasizes organized information, consistent analytical methods and clear presentation of electoral data.
Constituency Vote Share Reports
Structured reports covering candidate performance and party vote share.
Election Data Analysis
Organization and interpretation of constituency-level electoral records.
Historical Election Research
Comparisons of official election results across different years.
Assembly Data Analysis Reports
Detailed election reporting for Assembly constituencies and polling stations.
Assembly Data Analysis Report
For additional information about constituency-level election research, explore our Assembly Data Analysis Report . This resource provides further context for structured Assembly election reporting.
Election Research Across Uttar Pradesh
Click2Public Technologies works with election research topics across Lucknow, Agra, Varanasi, Kanpur, Meerut, Ghaziabad, Prayagraj, Gorakhpur and other regions.
Our focus includes constituency research, electoral data organization, vote-share analysis and historical election reporting.
Uttar Pradesh Vote Share Frequently Asked Questions
What is Uttar Pradesh Constituency Wise Vote Share Analysis?
It is the analysis of candidate and political party vote percentages across individual Assembly and Lok Sabha constituencies in Uttar Pradesh.
How many Assembly constituencies are there in Uttar Pradesh?
Uttar Pradesh has 403 Assembly constituencies.
How many Lok Sabha seats are there in Uttar Pradesh?
Uttar Pradesh has 80 Lok Sabha constituencies.
How is constituency vote share calculated?
Divide the votes received by a candidate by the relevant total valid votes and multiply the result by 100.
What is the difference between vote share and seat share?
Vote share is the percentage of votes received. Seat share is the percentage of constituencies won.
Where can official Uttar Pradesh election results be found?
Official results and relevant election records may be accessed through the Election Commission of India and appropriate state election authorities.
What is Form 20 in election analysis?
Form 20 is an official final result sheet containing candidate-wise vote information. It is useful for detailed election research.
Can Assembly and Lok Sabha vote shares be compared?
They can be studied together for broader historical context. However, differences in election type, constituency boundaries, candidates and voter participation must be considered.
Why is historical vote share analysis important?
Historical comparisons help researchers understand measurable changes in candidate and party performance across elections.
What does Click2Public Technologies focus on?
Click2Public Technologies focuses on political research, constituency analysis, election data analytics and structured electoral reporting.
Understanding Uttar Pradesh Elections Through Constituency Vote Share Data
Uttar Pradesh Constituency Wise Vote Share Analysis provides a detailed framework for understanding election results across the state's 403 Assembly and 80 Lok Sabha constituencies.
By examining candidate votes, party percentages, turnout and historical results, researchers can gain a clearer understanding of constituency-level electoral performance.
Official election records, including relevant Form 20 documents, provide an important foundation for accurate numerical analysis.
Reliable reporting requires consistent calculations, verified information and transparent research methods. These principles help ensure that constituency comparisons are meaningful and understandable.
Click2Public Technologies focuses on election data analytics, Assembly constituency research and structured political reporting across Uttar Pradesh and India.
Get Uttar Pradesh Constituency Vote Share Analysis
Contact Click2Public Technologies for election data research, constituency-wise vote share reports, historical election analysis and structured electoral reporting.