
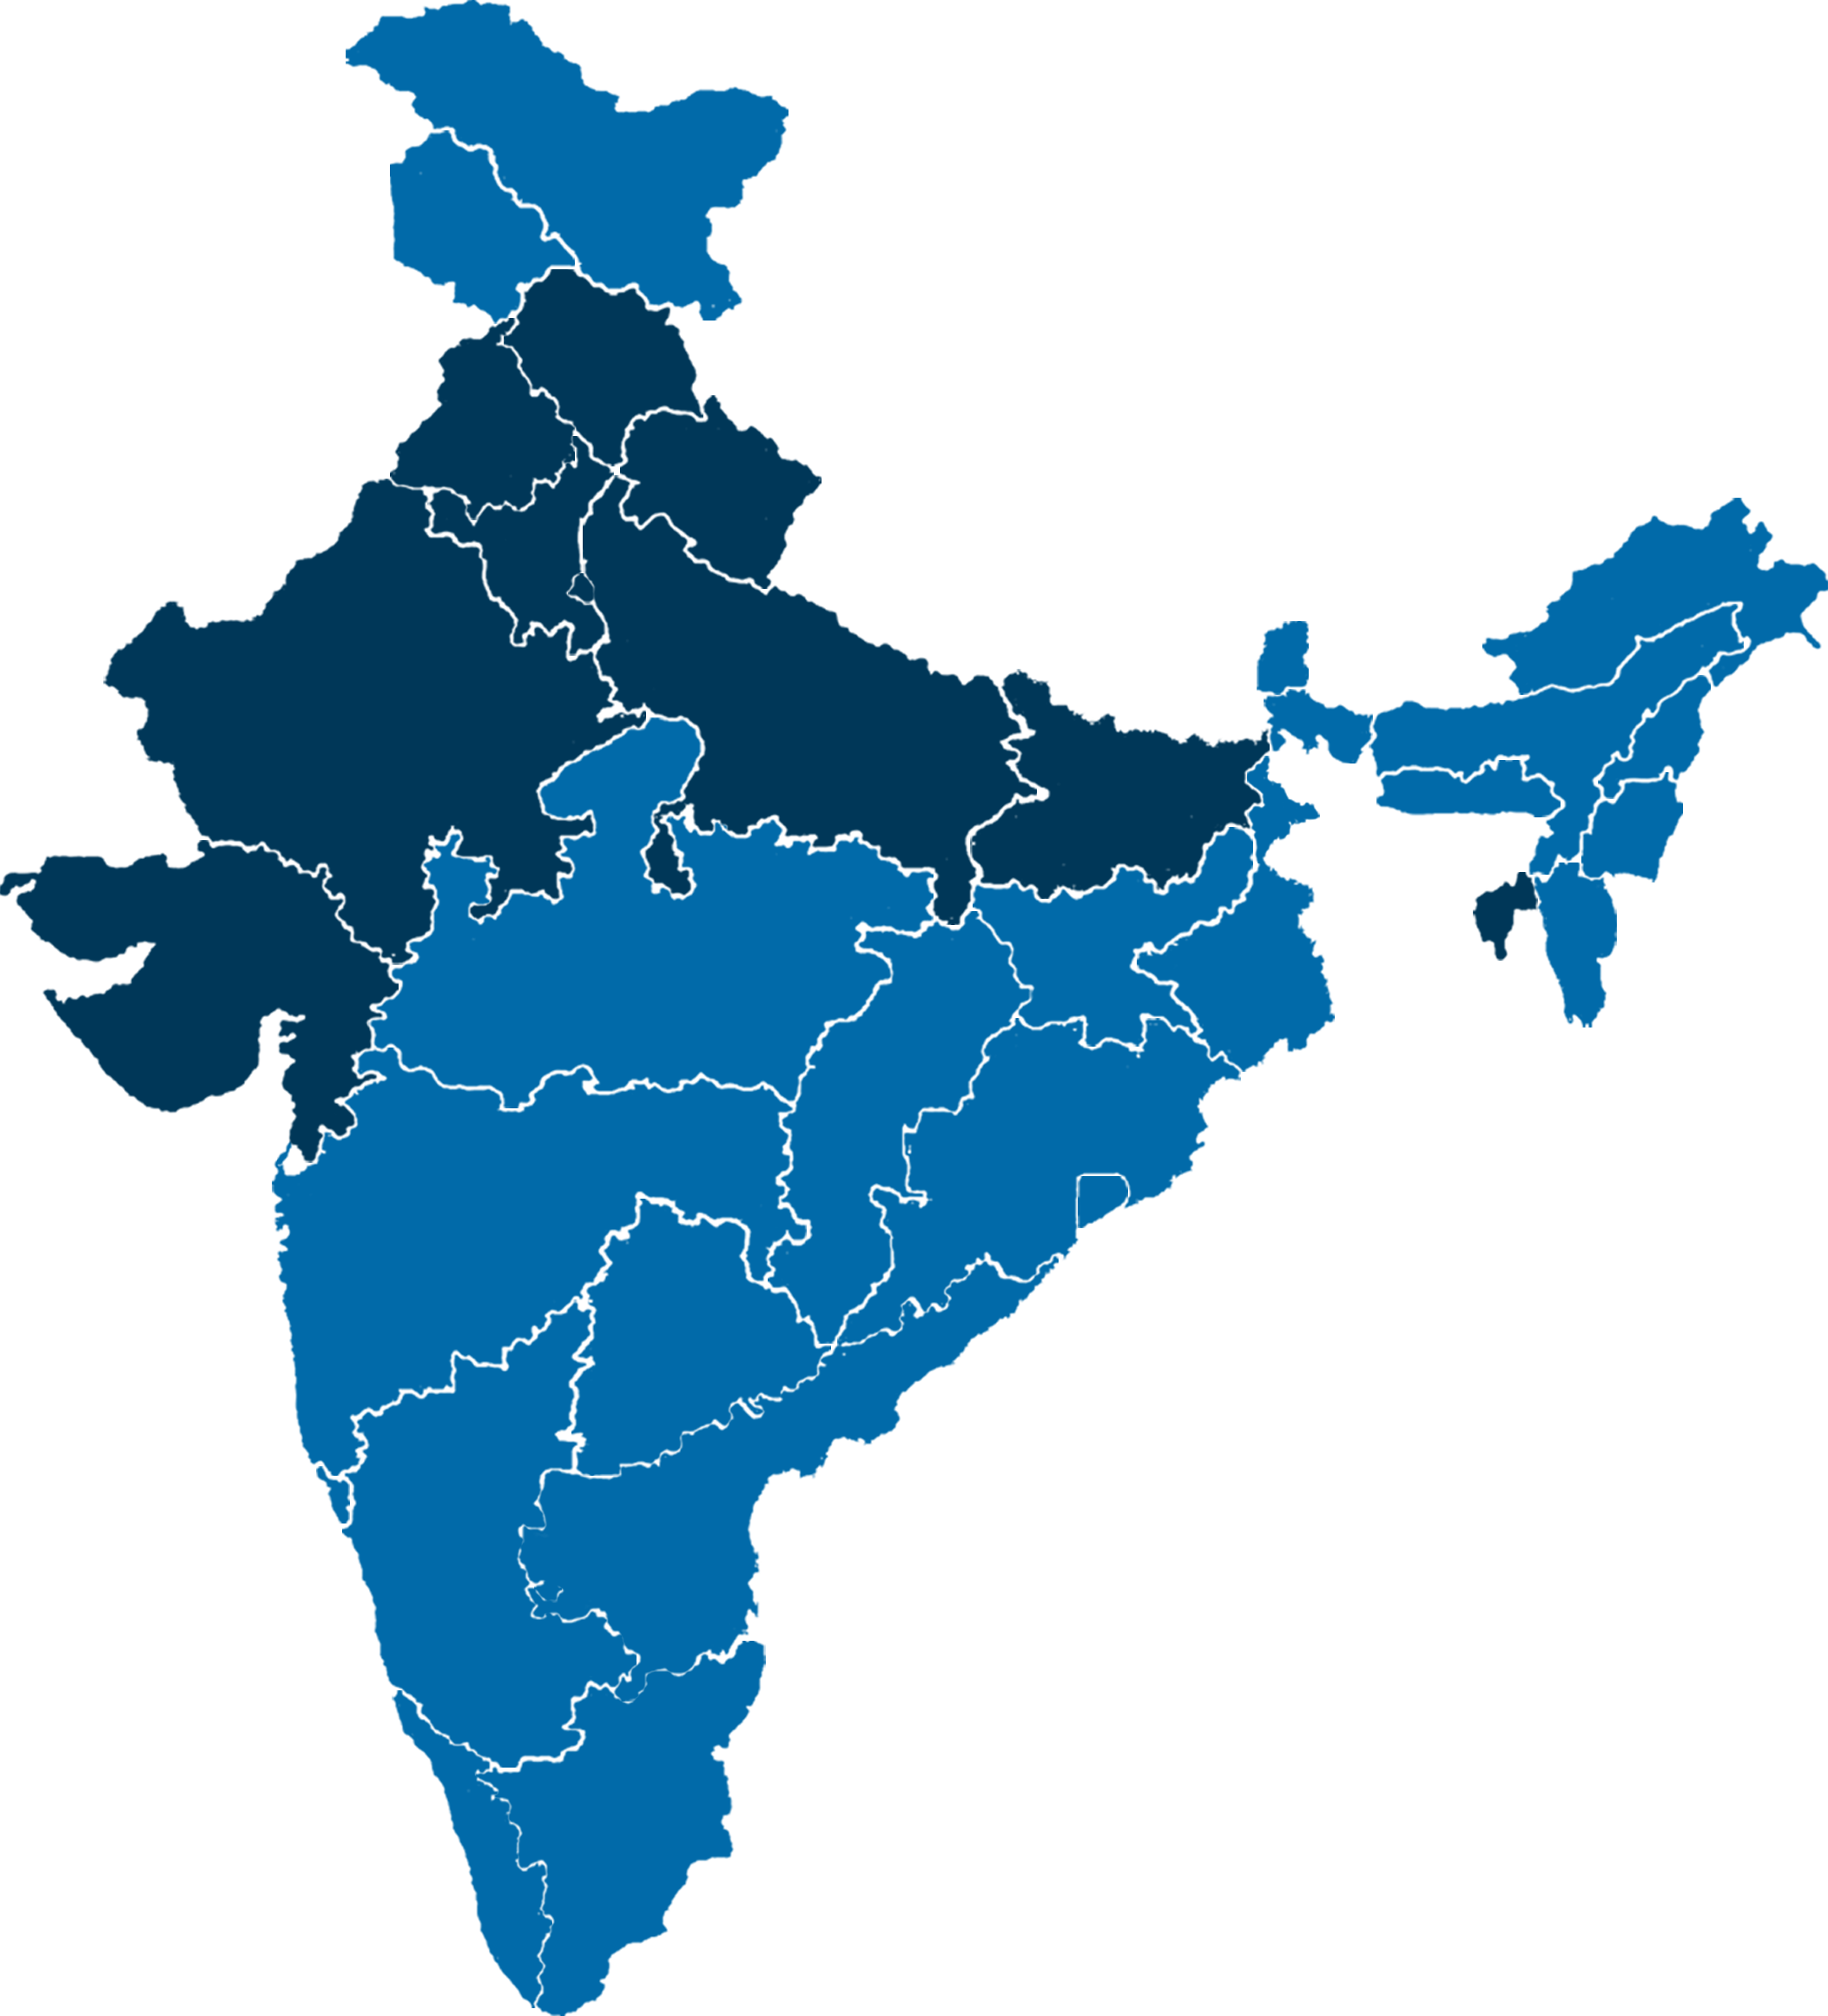

Uttar Pradesh Panchayat Level Election Data
A comprehensive, data-driven guide to Gram Panchayat election results, district-wise records, village-level participation, vote share, historical trends and transparent rural electoral analysis.
Panchayat Election Data Overview
Illustrative analytical dimensions (not actual vote totals).
Uttar Pradesh Panchayat Level Election Data: An Essential Guide
Uttar Pradesh Panchayat Level Election Data is an important resource for understanding rural elections, local democratic representation, and the performance of candidates across Gram Panchayats. Panchayat elections connect residents with the local institutions responsible for village administration and rural development.
For election researchers, journalists, academic institutions and analysts, structured Panchayat election records make it possible to study candidate-wise results, voter participation, winning margins, and changes across election cycles. Yet official information may be distributed across different publications, administrative levels and formats. Organizing these records into consistent datasets is therefore a central part of reliable election analysis.
Click2Public Technologies focuses on presenting election research in accessible, structured formats. This guide explains how Uttar Pradesh Panchayat election data can be interpreted, verified and presented without confusing local-body elections with Assembly or Lok Sabha contests.
Village-level insights
Examine Gram Panchayat and ward results where official records permit.
Historical comparisons
Understand differences in turnout, vote share and competitiveness across elections.
Clear reporting
Turn fragmented electoral records into readable tables and visual explanations.
Understanding the Uttar Pradesh Panchayati Raj Election Structure
Uttar Pradesh's rural local-government system has three principal levels: Gram Panchayat, Kshetra Panchayat and Zila Panchayat. Each operates at a different administrative scale. A good data report clearly identifies the office being contested, the corresponding geographical unit and the relevant election year.
Gram Panchayat
Village-level institutions, including elections for Gram Pradhan and Gram Panchayat members.
Kshetra Panchayat
Intermediate institutions organized at the block level, with their own electoral divisions.
Zila Panchayat
District-level rural institutions with elected representatives and district-scale responsibilities.
These tiers should not be merged into a single candidate ranking because they represent different offices and electorates. Researchers should also record reservation status and boundary changes when comparing historical elections.
Gram Panchayat and Village-Wise Election Results Analysis
Gram Panchayat election results provide the starting point for local electoral analysis. Candidate-wise votes, final rankings and victory margins help explain the competitiveness of a contest. When village- or ward-level records are available, researchers can examine smaller geographical units rather than relying only on district-wide summaries.
What should a results report include?
Useful fields include district, block, Gram Panchayat name, ward identifier, election year, office contested, candidate name, votes received, valid votes, winner status and source document. Consistent identifiers reduce confusion where villages share names or spelling variations.
| Data field | Purpose | Verification |
|---|---|---|
| Candidate votes | Measure individual performance | Official result statement |
| Winning margin | Measure closeness of contest | Winner minus runner-up |
| Valid votes | Calculate vote share | Official counting record |
| Turnout | Measure electoral participation | Votes cast and registered electors |
| Administrative unit | Locate each contest correctly | District/block/Panchayat registers |
Winning margin analysis
The winning margin is calculated by subtracting the runner-up's vote total from the winner's vote total. A small margin indicates a close contest, but the result should also be considered in relation to total valid votes and the number of candidates.
District-Wise Uttar Pradesh Panchayat Election Data
District-level reporting provides a practical way to organize local election records across Uttar Pradesh's 75 districts. Each district contains multiple rural administrative units, and the availability of detailed records can vary by election year and local body. District-wise datasets can be broken down further by development block, Gram Panchayat and ward.
Districts frequently included in regional election research
A district report should make clear whether it covers all Panchayats or only a subset. It should also disclose any unavailable polling records and distinguish verified data from illustrative charts.
Block-wise Panchayat analysis
Block-level aggregation connects individual Gram Panchayat results with broader district summaries. Researchers can compare the distribution of winning margins, turnout and candidate counts across blocks, provided the underlying records are sufficiently complete.
Voter Turnout Analysis in Gram Panchayat Elections
Voter turnout indicates the proportion of registered electors who cast ballots. It is an important measure of electoral participation and can be examined across districts, blocks and election cycles where official figures are available.
If a hypothetical Panchayat has 4,000 registered electors and 3,200 votes cast, the turnout rate is 80%. Researchers should use the official definition of votes cast and account for differences between turnout and valid-vote totals.
Participation can vary for many reasons, including polling access, local circumstances and administrative arrangements. Aggregate turnout alone cannot establish why individuals voted or abstained, so causal claims require separate evidence.
Historical Uttar Pradesh Panchayat Election Trends
Historical election analysis helps explain how local representation and electoral competitiveness have changed. Researchers may compare records from different Panchayat election cycles, such as 2015 and 2021, when comparable official results are available.
However, changes in ward boundaries, reservation arrangements, the electorate and the number of candidates can affect comparability. Every historical report should explain which administrative units have been matched and which comparisons are not valid.
Useful historical indicators
Indicators include changes in turnout, the number of candidates, victory margins, vote share distributions and incumbent re-election outcomes. These are descriptive measures, not evidence of any individual's voting choice.
For a related perspective on state-level constituency results, visit the Click2Public Assembly Data Analysis Report. Assembly election records should be analyzed separately from Panchayat elections because their electoral units and institutional purposes differ.
How Data Analytics Improves Panchayat Election Research
Reliable Panchayat election analytics begins with careful data collection. Researchers should obtain official records, preserve their source references, standardize names and identifiers, and check totals before calculating any percentages.
Data collection and validation
Election records can appear as web pages, spreadsheets, PDFs or scanned documents. Converting them into a consistent dataset requires quality checks for missing values, duplicate rows and inconsistent spellings. Source dates and the election year should remain attached to each record.
Dashboards and visual reporting
Tables, charts and maps can make large datasets easier to explore. A useful dashboard might allow filtering by district, block, Panchayat, office and election year. Charts should be labeled clearly and should never present sample values as official statistics.
Responsible interpretation
Public election analysis should focus on aggregate, verified records. Secret ballots do not reveal individual voting choices, and group-level patterns should not be treated as proof of personal political preferences.
Data accuracy
Check candidate totals and match every record to a source.
Clear geography
Use consistent district, block and Panchayat identifiers.
Useful visuals
Show trends with properly labeled charts and tables.
Official Sources and Election Data Methodology
The Uttar Pradesh State Election Commission is an essential official source for Panchayat election information. Relevant government publications and authenticated local election records may also help confirm administrative details.
A transparent analytical workflow should document the source, election date, administrative unit, candidate records, calculation rules, missing data and any boundary adjustments. Analysts should distinguish reported facts from calculated statistics and interpretation.
Recommended verification workflow
- Identify the election year and the office contested.
- Collect the official result statement and relevant electoral statistics.
- Standardize district, block, Panchayat and ward names.
- Validate vote totals, percentages and winner rankings.
- Document missing or ambiguous records.
- Publish findings with a source note and last-updated date.
This page is an explanatory guide and does not claim to contain a complete official database of Panchayat results.
Essential Fields in a Panchayat Election Dataset
Administrative identifiers
A reliable dataset should preserve the district, development block, Gram Panchayat, ward or territorial constituency, office contested and election year. Village names alone are not dependable identifiers because similar names can occur in different blocks or districts. Where government codes exist, store them alongside the published name and retain the original spelling as a separate field.
Candidate and result fields
Record the candidate name exactly as published, votes received, result status and the source document. Include valid votes, rejected ballots and total votes polled only when these figures are provided or can be reconciled from an authoritative counting statement. Do not infer missing totals from incomplete candidate lists.
Source and quality fields
Add a document title, issuing authority, publication date, retrieval date and URL or archive reference. A review-status field can distinguish confirmed, provisional, disputed and unavailable records. This small addition prevents readers from mistaking an incomplete data extract for a final official result.
Why a data dictionary matters
A data dictionary defines each column, the expected unit and permissible values. For example, vote share uses valid votes as its denominator, whereas turnout typically uses registered electors. Documenting these definitions makes reports easier to reproduce and reduces errors when datasets are combined.
Gram Pradhan and Panchayat Ward Result Interpretation
Different offices require different comparisons
A Gram Pradhan election and a Gram Panchayat member election may occur within the same geographical area, but they are separate contests. Their candidate lists, electorates and results must not be added together. An analytical report should clearly state whether it describes the Pradhan election, a ward election or another Panchayati Raj office.
Understanding closely contested elections
A victory margin of 50 votes can represent a very different level of competitiveness in an election with 500 valid votes than in one with 5,000. In addition to the absolute margin, analysts can report the margin as a percentage of valid votes. This provides context without implying why the result occurred.
Uncontested and incomplete records
Some contests may have no polling because a candidate was returned unopposed. Such results should be categorized separately from elections with votes cast. If a result sheet is missing, the dataset should say unavailable rather than assigning a zero vote total, which would be misleading.
Reading results responsibly
Candidate vote totals show the outcome of a particular contest, not an individual ballot choice or a community’s political identity. Local issues and candidate-specific circumstances can vary between elections, so interpretation should stay close to the published evidence.
Step-by-Step Process for Building a District-Wise Panchayat Report
Step 1: Define the scope
Specify the election year, district, offices and geographical units before gathering data. A report on all Gram Pradhan contests in a district is different from a report covering selected wards or Zila Panchayat territorial constituencies. Clear scope statements make completeness measurable.
Step 2: Build a source register
Create a source register containing every official results document and its date. Preserve a copy or stable reference where permitted. If documents have been corrected, record the revised version and explain which publication is used for the final analysis.
Step 3: Normalize and reconcile
Standardize names carefully, then check that candidate votes and published totals reconcile where possible. Flag spelling collisions, duplicate records and unexpected negative or impossible percentages. Review anomalies against the original result statement instead of silently modifying numbers.
Step 4: Calculate and review
Compute vote share, winning margin and turnout only when the necessary denominators are known. Have a second reviewer spot-check a sample of records and every unusual result. Keep formulas and transformations documented so another researcher can reproduce the findings.
Step 5: Publish accessible findings
Present a readable summary first, followed by district and block tables, source notes and downloadable data where licensing permits. Provide clear labels for provisional results, illustrative examples and unavailable information. Include the publication or update date so visitors can judge how current the report is.
Comparing Uttar Pradesh Panchayat Election Cycles Accurately
Match comparable administrative units
An apparent change in a Panchayat result may reflect a change in ward boundaries rather than a change in voter participation. Before comparing years, confirm that the administrative units are equivalent. Where boundaries differ, explain the limitation or report the years separately.
Account for reservations and candidate changes
Reserved offices and rotation of reservation categories can alter who is eligible to contest. Candidate rosters can also change substantially. Historical analysis should describe these institutional differences rather than treating every election as a like-for-like rematch.
Use both totals and percentages
Raw votes provide scale, while percentages provide context. A candidate can receive more votes in a later election but a smaller share if the valid-vote total increased. Reporting both measures gives readers a more complete understanding of the outcome.
Avoid unsupported causal conclusions
A turnout increase is a measurable fact when supported by official records. The reason for the increase is a separate research question. Do not attribute changes to a specific campaign, issue or population group without independent evidence.
Useful Panchayat Election Dashboards and Public Reports
District overview
A district overview can summarize the number of verified contests, available turnout records and the range of victory margins. It should also display the percentage of records that have passed validation so visitors can assess coverage.
Block comparison
A block comparison table can group results by development block, with filters for year and office. It should avoid ranking blocks on incomplete information unless the coverage limitation is clearly stated.
Gram Panchayat detail page
An individual Gram Panchayat page can show the relevant office, candidate list, final votes, winner, runner-up, margin and source. A historical tab can show earlier results only when the units are comparable.
Downloadable data and accessibility
Offer accessible tables with column headings, readable contrast and a CSV export when appropriate. Provide text descriptions of charts and keep the underlying figures visible. A dashboard is most useful when its visuals can be checked against the original records.
Common Mistakes to Avoid in Panchayat Election Data Analysis
Confusing Panchayat and Assembly boundaries
A village may fall within an Assembly constituency, but the two elections are conducted for different institutions. Their vote totals should not be merged into a single result or treated as directly interchangeable.
Using incorrect denominators
Vote share should be calculated using valid votes in the relevant contest. Turnout uses the appropriate registered-elector count. Mixing these denominators produces percentages that may look plausible but are mathematically incorrect.
Treating missing information as zero
A blank vote count, missing turnout field or unavailable ward result does not mean that no votes were cast. Use explicit missing-data labels and describe the extent of incomplete coverage.
Presenting illustrations as official results
Sample charts are useful for explaining calculations, but they should be marked as hypothetical. Actual candidate names, figures and winners should only be shown after source verification.
Ignoring publication dates
Election pages can become outdated as revised documents or new elections are published. A clear last-verified date and source list help visitors understand the status of the information.
Frequently Asked Questions
What is Uttar Pradesh Panchayat Level Election Data?
It includes available election records for rural local government institutions, such as candidate results, votes, turnout and winning margins.
Where can I find official Gram Panchayat election results?
Start with the Uttar Pradesh State Election Commission and relevant official election publications for the district and election year.
Can Panchayat and Assembly election data be compared directly?
They concern different institutions and electoral units. Broad comparisons need careful qualification and should not merge unrelated contests.
How is a winning margin calculated?
Subtract the runner-up's vote total from the winning candidate's vote total.
Are village-wise records available for every election?
Availability varies by year, local body and publication. Verify the geographical detail of each official dataset.
How can Click2Public support election research?
Click2Public focuses on structured election analysis, historical comparisons, constituency research and accessible reporting formats.
What is the difference between vote share and turnout?
Vote share measures a candidate’s proportion of valid votes in a contest. Turnout measures votes cast as a proportion of registered electors.
How should an unopposed Panchayat result be reported?
Label it as an unopposed return and do not invent polling totals or a winning margin.
Can I compare Gram Pradhan results across years?
Yes, when the office and administrative boundaries are comparable and official records support the comparison.
What makes a district Panchayat dataset reliable?
Clear scope, official source references, consistent identifiers, documented calculations and explicit missing-data notes.
Explore More Election Data Analysis
Review our Assembly Data Analysis Report and learn more about structured election research, vote-share comparisons and electoral reporting.
View Assembly Data Analysis Report ↗