
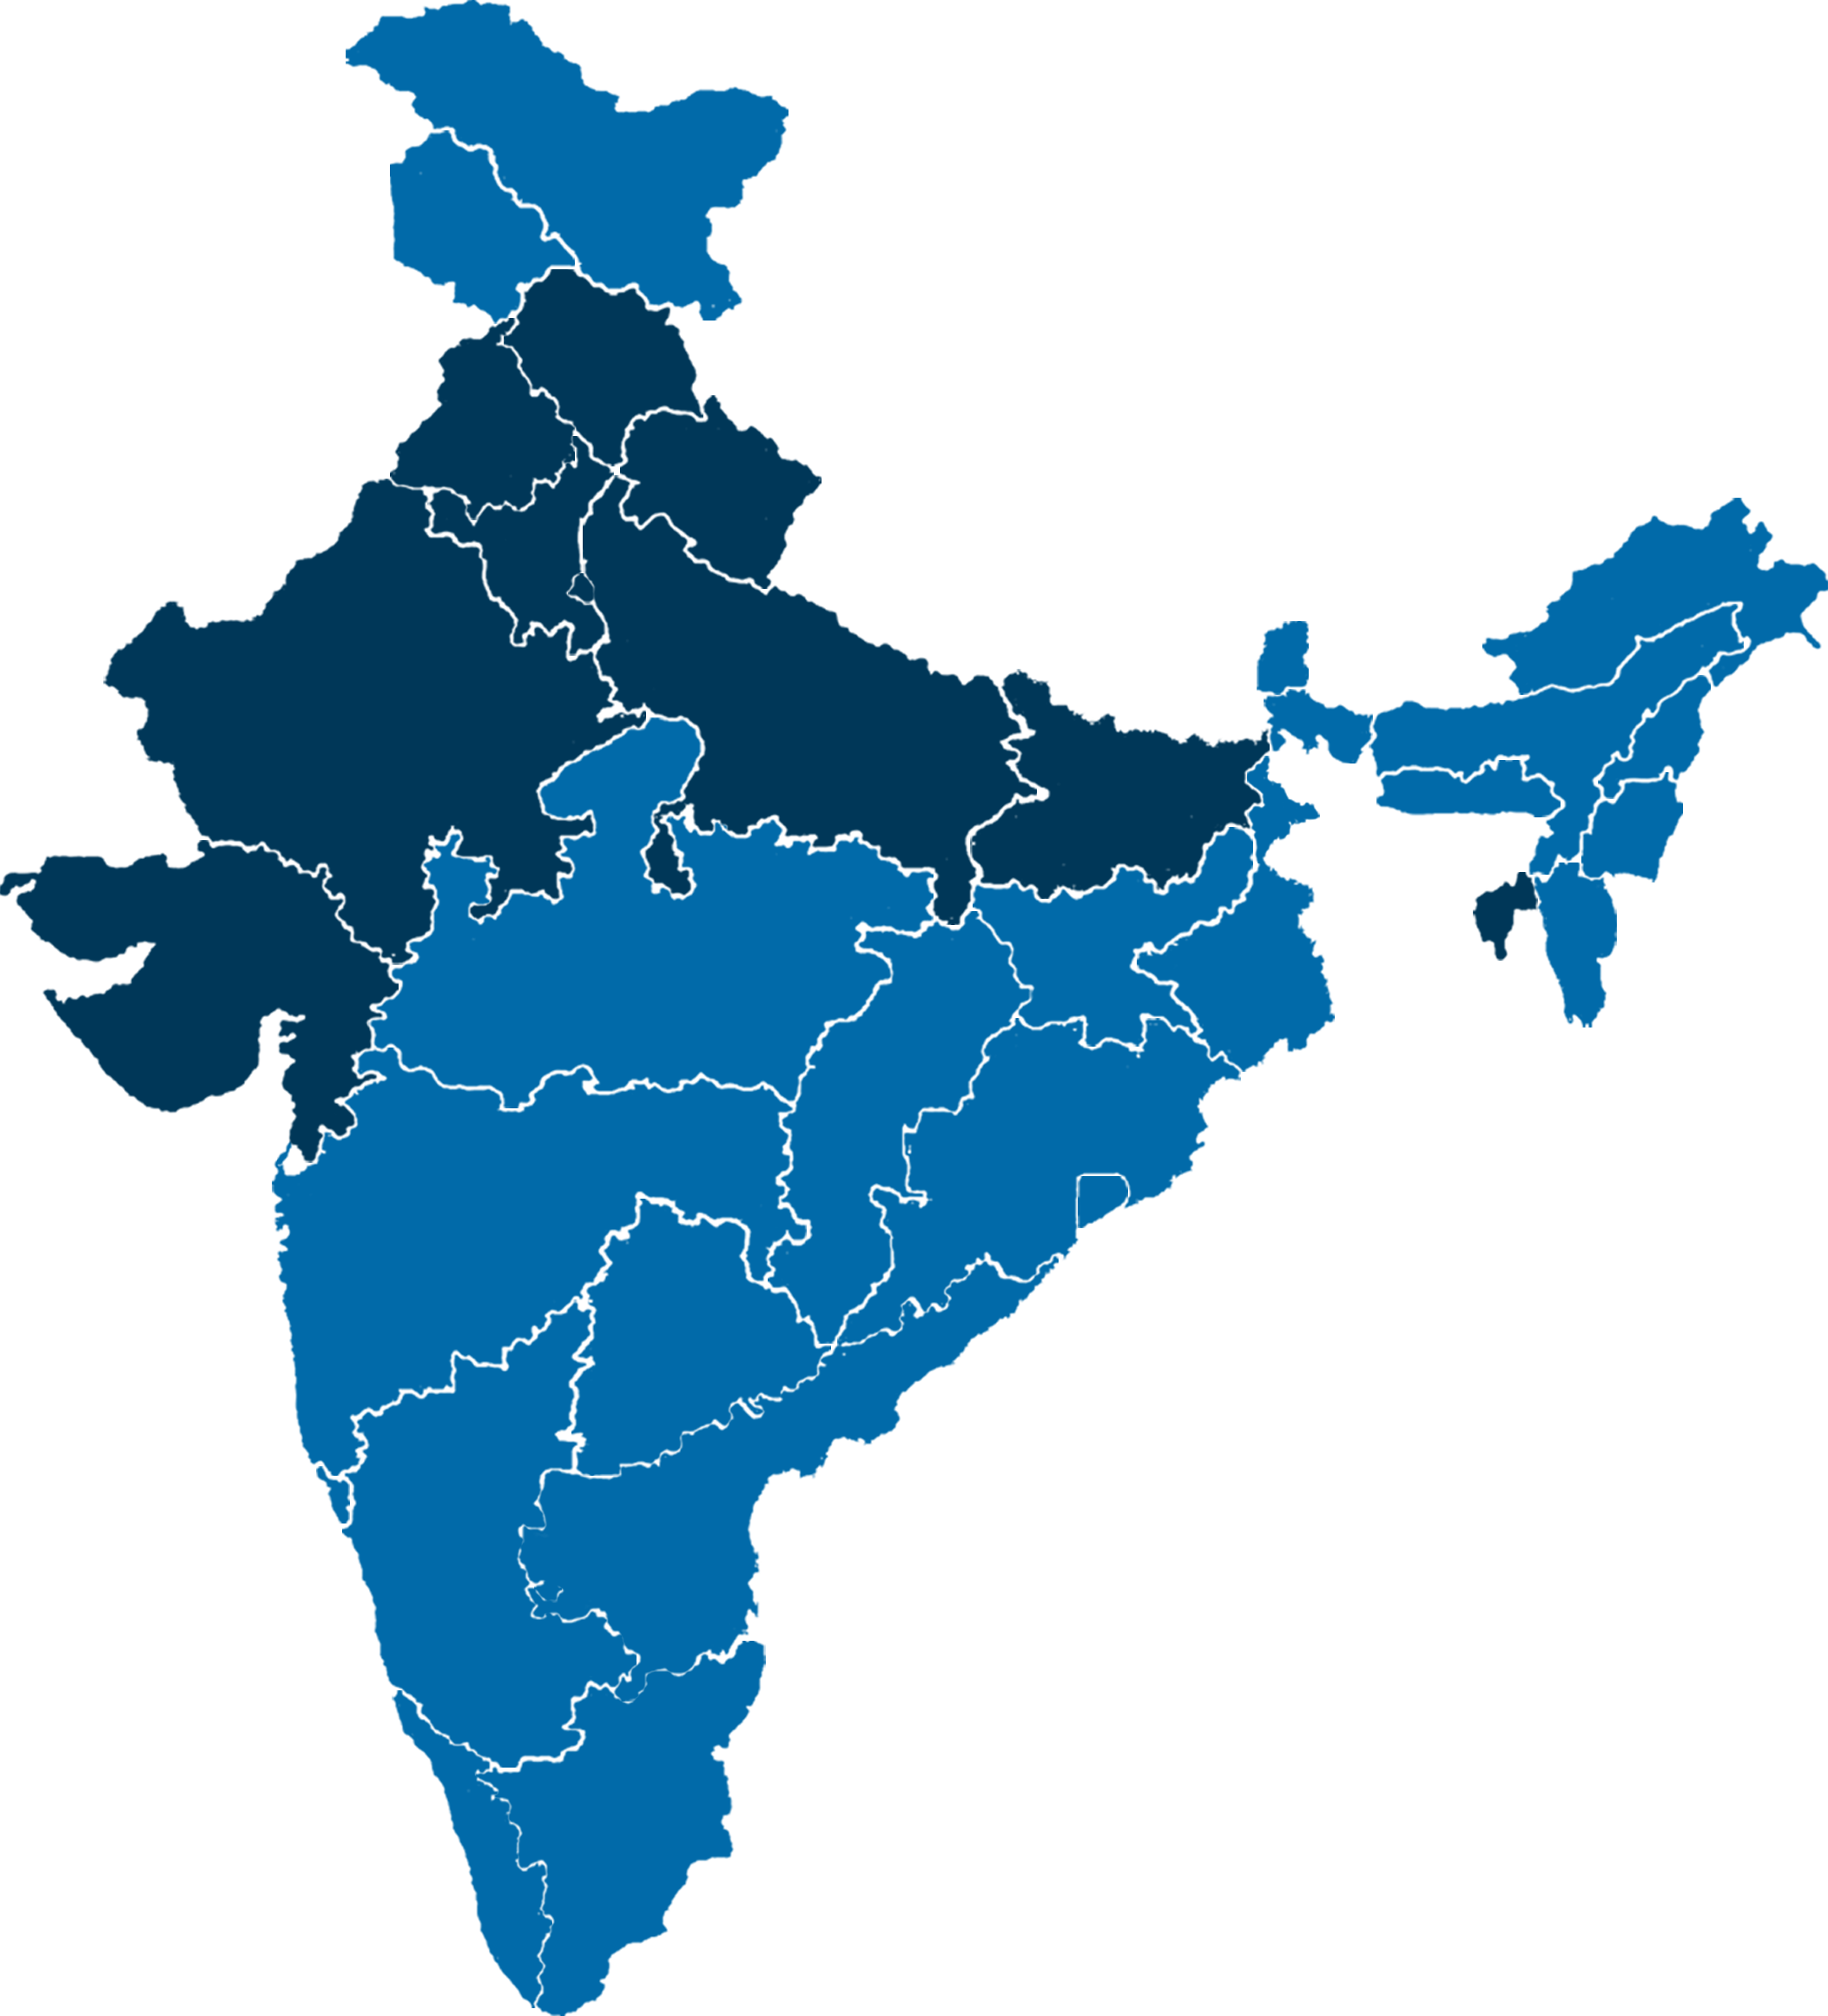

Uttar Pradesh Historical Election Data Analysis
Explore Uttar Pradesh's political and electoral history through Assembly and Lok Sabha election results, constituency-wise voting patterns, political party performance, historical vote share, voter turnout, winning margins and detailed election research.
Uttar Pradesh Historical Election Data Analysis: Complete Overview
Uttar Pradesh is one of the most politically influential states in India. With 403 Legislative Assembly constituencies, 80 Lok Sabha constituencies and 75 districts, the state has a major role in determining the country's political direction.
Understanding the state's electoral history requires more than reviewing the final winners of previous elections. A detailed Uttar Pradesh Historical Election Data Analysis examines constituency-wise voting patterns, party performance, candidate results, winning margins, voter turnout and changes in electoral competition across multiple election cycles.
Historical election data provides valuable information about how the political landscape has evolved. By comparing past Assembly and parliamentary elections, researchers can identify major electoral transitions, changing party performance and differences between regional voting patterns.
For example, a political party may perform strongly in one parliamentary election but face different results during a state Assembly election. These variations may reflect differences in candidates, alliances, political issues, turnout and local circumstances.
Therefore, researchers should study each election within its historical context instead of assuming that one election result directly explains another.
At Click2Public Technologies, election data research focuses on converting historical electoral information into structured, accessible and meaningful analytical reports.
Major Components of Historical Election Research
Assembly Election History
Analysis of previous Uttar Pradesh Legislative Assembly elections, party seat distribution, candidate performance and historical changes in political representation.
Lok Sabha Election History
Comparison of parliamentary election results, constituency-wise winners, political alliances and historical party performance.
Constituency-Wise Results
Detailed examination of voting patterns, candidate vote totals and winning margins across Assembly and parliamentary constituencies.
Booth-Level Election Data
Polling-station-level election research and historical comparisons where verified official records are available.
Vote Share Analysis
Evaluation of changes in party vote share and candidate performance across election cycles.
Voter Turnout Analysis
Historical comparison of voter participation, registered electors and turnout patterns across different regions.
Historical Political Evolution of Uttar Pradesh
The political history of Uttar Pradesh reflects several major changes in electoral competition and political party representation. Over different periods, the Indian National Congress, Samajwadi Party, Bahujan Samaj Party and Bharatiya Janata Party have played important roles in state politics.
Political transitions in Uttar Pradesh have often been accompanied by changes in alliances, candidate performance, regional competition and electoral participation.
2007 Uttar Pradesh Assembly Election
The 2007 Assembly election marked an important political development when the Bahujan Samaj Party secured 206 seats in the 403-member Legislative Assembly.
The result gave the BSP an absolute majority. Historical analysis of this election can examine the party's constituency-level performance, winning margins and distribution of votes across different districts.
2012 Uttar Pradesh Assembly Election
In 2012, the Samajwadi Party won 224 seats and formed the state government. The result represented a significant change from the previous Assembly election.
A comparison between the 2007 and 2012 results helps explain changes in party representation and the geographical distribution of electoral success.
2017 Uttar Pradesh Assembly Election
The 2017 election produced another major transition. The Bharatiya Janata Party secured 312 seats, achieving a substantial majority in the Assembly.
Historical research can examine how party performance changed between 2012 and 2017, including changes in seat distribution and constituency-level electoral competitiveness.
2022 Uttar Pradesh Assembly Election
In the 2022 Assembly election, the BJP won 255 seats and retained a majority. The Samajwadi Party secured 111 seats, while other political parties also won representation in the Assembly.
Comparing the 2017 and 2022 results reveals changes in party seat distribution. However, the interpretation of these changes also requires vote share, turnout and candidate-level information.
Uttar Pradesh Assembly Election Results Historical Comparison
A historical comparison of Assembly election results helps researchers understand the evolution of political competition in Uttar Pradesh.
The following table summarizes the leading party and its number of seats in four major Assembly election cycles.
| Election Year | Leading Party | Seats Won | Total Seats |
|---|---|---|---|
| 2007 | BSP | 206 | 403 |
| 2012 | SP | 224 | 403 |
| 2017 | BJP | 312 | 403 |
| 2022 | BJP | 255 | 403 |
Figures represent seats won by individual parties, not combined alliance totals. Historical results should be verified using Election Commission of India records.
Historical Assembly Seat Share Comparison
These percentages represent the proportion of Assembly seats won by the leading party. They do not represent vote share.
Why Compare Multiple Assembly Elections?
Comparing multiple election cycles provides a broader historical perspective than examining a single result.
For instance, an individual constituency may elect candidates from different political parties over successive elections. Such changes can be examined alongside turnout, winning margins, candidate changes and constituency boundaries.
Additionally, statewide seat totals can conceal local variations. Therefore, detailed constituency analysis is necessary to understand the full historical picture.
Uttar Pradesh Lok Sabha Historical Election Data Analysis
Uttar Pradesh sends 80 elected representatives to the Lok Sabha, the largest allocation among Indian states.
As a result, the state's parliamentary election outcomes have considerable importance in national political developments.
2014 Lok Sabha Election in Uttar Pradesh
During the 2014 general election, the BJP won 71 Lok Sabha seats in Uttar Pradesh, while its ally Apna Dal secured two seats.
This result represented a major change in parliamentary representation. Historical analysis can examine the constituency-level distribution of seats, candidate vote totals and victory margins.
2019 Lok Sabha Election in Uttar Pradesh
In the 2019 general election, the BJP won 62 parliamentary seats in the state. The BSP, SP, Congress and other parties also participated in the electoral competition.
Comparisons with the 2014 election can reveal changes in parliamentary seat distribution and constituency-level results.
2024 Lok Sabha Election in Uttar Pradesh
The 2024 parliamentary election produced a different distribution of seats. The Samajwadi Party secured 37 seats, the BJP won 33 seats and Congress won six.
The Rashtriya Lok Dal won two seats, while Apna Dal (Soneylal) and Aazad Samaj Party (Kanshi Ram) won one seat each.
Lok Sabha Election Seat Comparison
| Year | BJP | SP | Congress | Other Parties |
|---|---|---|---|---|
| 2014 | 71 | 5 | 2 | 2 |
| 2019 | 62 | 5 | 1 | 12 |
| 2024 | 33 | 37 | 6 | 4 |
Other Parties includes all parties outside the three separately listed columns. Results are based on individual party seat totals.
These results demonstrate the importance of comparing multiple election cycles. However, differences in party alliances, candidate selection and electoral circumstances should be considered before drawing conclusions.
Constituency-Wise Historical Election Data in Uttar Pradesh
Constituency-wise historical election analysis is an essential component of detailed electoral research. Every Assembly and Lok Sabha constituency has its own electoral history, candidate competition and voting patterns.
A constituency-level report can include previous election winners, runner-up candidates, political party vote share, total votes polled, turnout percentages and historical winning margins.
Previous Election Winners
Studying previous winners helps document how political representation has changed across election years.
Researchers can compare whether a constituency has repeatedly elected candidates from the same party or experienced changes in political representation.
Candidate-Wise Vote Comparison
Candidate-level data allows detailed examination of votes received by each contestant. This is particularly useful when comparing closely contested elections.
Historical Winning Margin Analysis
Winning margins indicate the difference between the first- and second-place candidates. A small winning margin generally indicates a closely contested election.
However, margins should be examined alongside total votes polled and voter turnout, as constituencies may differ substantially in electorate size.
Constituency Boundary Changes
Historical comparisons must also account for constituency delimitation. Changes in electoral boundaries can affect the comparability of results across years.
Consequently, researchers should verify constituency boundaries before interpreting long-term changes in electoral performance.
Region-Wise Historical Election Trends in Uttar Pradesh
Uttar Pradesh includes diverse geographical, economic and administrative regions. Historical electoral analysis becomes more informative when constituency results are examined within their regional context.
Western Uttar Pradesh
Western Uttar Pradesh includes important districts such as Meerut, Saharanpur, Muzaffarnagar, Baghpat, Ghaziabad, Gautam Buddha Nagar and Agra. Historical research can compare urban, rural and semi-urban constituency results.
Central Uttar Pradesh
Central Uttar Pradesh includes Lucknow, Kanpur Nagar, Unnao, Sitapur and surrounding districts. Constituency-level analysis helps examine changes in urban and rural electoral competition.
Eastern Uttar Pradesh
Eastern Uttar Pradesh includes Varanasi, Gorakhpur, Azamgarh, Jaunpur, Ghazipur and nearby districts. Historical comparisons can examine changes in party performance across different election cycles.
Bundelkhand Region
Bundelkhand includes districts such as Jhansi, Banda, Mahoba, Hamirpur, Jalaun, Lalitpur and Chitrakoot. Historical election research can compare constituency-level results and participation trends.
Why Regional Election Analysis Matters
A statewide election result does not necessarily reflect identical voting patterns in every district. Some constituencies may experience major changes in electoral competition while others show greater continuity.
Therefore, regional comparisons can help researchers identify differences between constituencies and avoid overly broad conclusions.
Booth-Wise Historical Election Results Analysis in Uttar Pradesh
Booth-wise historical election analysis provides a detailed view of election results at the polling-station level.
Where verified polling-station records are available, researchers can examine candidate vote totals, turnout and differences between polling stations.
Polling Station Vote Comparison
Polling-station vote comparison examines the votes received by candidates at individual polling locations.
When suitable records are available, these results may be compared across multiple election cycles.
Booth-Level Voter Turnout
Turnout analysis can identify differences in participation between polling stations. However, variations should be interpreted with attention to changes in registered electors and polling-station arrangements.
Historical Booth Mapping
Polling stations may be renumbered, relocated or reorganized between elections. As a result, historical booth mapping is necessary before comparing polling-station-level results.
Data Accuracy and Verification
Reliable booth-level research requires careful checking of source documents, polling-station identifiers and election years.
Where records cannot be matched confidently, the comparison should clearly state the limitation rather than present uncertain results as verified.
Panchayat and Ward-Level Historical Election Research
Panchayat and urban ward-level analysis can provide additional geographical context for election research in Uttar Pradesh.
Rural and urban administrative boundaries may not align directly with Assembly constituency boundaries or polling-station arrangements. Therefore, accurate geographical mapping is important.
Panchayat-Level Election Data
Panchayat-level research may involve aggregating available polling-station results within relevant rural areas.
Such analysis can support historical comparisons when official records and reliable geographical mappings are available.
Urban Ward-Level Election Data
Urban ward analysis can examine local election results and changes in voting patterns across municipal areas.
However, municipal election results should not automatically be treated as equivalent to Assembly or parliamentary election outcomes.
Importance of Administrative Boundaries
Accurate historical research requires verification of administrative and electoral boundary changes. Without this step, geographical comparisons may be misleading.
Historical Vote Share Analysis in Uttar Pradesh Elections
Vote share is one of the most important indicators in historical election analysis. It measures the proportion of valid votes received by a candidate or political party.
For example, if a candidate receives 60,000 votes out of 150,000 valid votes, the candidate's vote share is 40%.
Why Vote Share Matters
Vote share provides additional context beyond the number of seats won. A party may experience changes in seat totals even when its statewide vote share changes by a smaller amount.
Party-Wise Vote Share Comparison
Comparing party vote shares across multiple election cycles helps researchers examine changes in electoral support.
However, comparisons should account for differences in alliances, party participation and constituency boundaries.
Constituency Vote Share Changes
At the constituency level, vote share can help identify changes in candidate performance across election years.
It can also provide context for close contests where the winning margin is relatively small.
Historical Winning Margin and Electoral Competition Analysis
Winning margin analysis helps researchers understand how closely an election was contested.
For example, if the winning candidate receives 95,000 votes and the runner-up receives 90,000 votes, the winning margin is 5,000 votes.
Close Electoral Contests
A relatively small winning margin indicates that the leading candidates received similar numbers of votes.
Historical comparisons can examine whether constituencies experienced repeated close contests or substantial changes in margins.
Winning Margin Percentage
Because constituencies differ in size, researchers may also calculate winning margin as a percentage of valid votes.
Interpreting Margin Changes
Changes in winning margins should be considered alongside turnout, candidate participation, political alliances and the number of contesting candidates.
Historical Voter Turnout Analysis in Uttar Pradesh
Voter turnout is an essential component of election data analysis. It helps researchers understand participation levels across different election cycles.
Assembly Election Turnout
Historical Assembly turnout data can be compared across districts, constituencies and election years.
These comparisons may highlight changes in electoral participation and differences between regions.
Lok Sabha Election Turnout
Parliamentary election turnout provides another perspective on voter participation.
However, Assembly and parliamentary turnout should be analyzed separately before attempting broader comparisons.
Urban and Rural Turnout Comparison
Where appropriate data is available, researchers can compare participation patterns between urban and rural constituencies.
Registered Electors and Turnout
Changes in the number of registered electors can influence comparisons of total votes polled.
Therefore, turnout percentages and electorate size should be considered together.
Assembly vs Lok Sabha Historical Election Data Comparison
Assembly and Lok Sabha elections represent different levels of political representation.
Although both election types involve the same state's electorate, their results may differ because of candidates, political issues, alliances and election-specific circumstances.
Differences in Constituency Structure
Uttar Pradesh contains 403 Assembly constituencies and 80 Lok Sabha constituencies.
A parliamentary constituency generally includes multiple Assembly segments.
Comparing Assembly Segments
Where official segment-level parliamentary results are available, researchers can compare them with Assembly election outcomes.
However, these comparisons must account for differences in election year and context.
Understanding Split Electoral Outcomes
A constituency may produce different results in Assembly and parliamentary elections.
Such differences demonstrate why historical analysis should avoid treating all election types as interchangeable.
Methodology for Uttar Pradesh Historical Election Data Analysis
Reliable election analysis requires a systematic methodology. Data collection, verification, standardization and interpretation are all important steps.
Step 1: Collect Official Election Results
Gather election records from the Election Commission of India and other relevant official election authorities.
Step 2: Organize Election Data
Structure historical results according to election year, constituency, candidate, political party and votes received.
Step 3: Verify Historical Records
Check candidate names, party affiliations, vote totals, winning margins and constituency identifiers.
Step 4: Standardize Data
Account for constituency delimitation, party name changes and differences in election reporting.
Step 5: Calculate Key Indicators
Calculate vote share, winning margin, turnout and seat share using consistent definitions.
Step 6: Compare Election Cycles
Examine historical changes while accounting for differences in election type and political context.
Step 7: Prepare Research Reports
Present verified results through structured tables, charts and explanatory research summaries.
Explore Assembly Data Analysis
Learn more about historical election results, constituency research, vote share analysis and election data reporting.
View Assembly Data Analysis ReportChallenges in Historical Election Data Analysis
Historical election research requires careful attention to data accuracy and comparability.
Constituency Delimitation
Electoral boundaries may change between election cycles. Therefore, historical comparisons should verify whether constituency boundaries remained consistent.
Political Party Alliances
Political alliances may change between elections. Comparing individual party results without accounting for alliance changes may produce incomplete conclusions.
Candidate Changes
Candidates may change parties, contest from different constituencies or not participate in later elections.
These factors should be documented during candidate-level comparisons.
Incomplete Historical Records
Some older polling-station records may not be readily available in digital formats.
Researchers should clearly identify unavailable data and avoid inventing missing results.
Data Interpretation
Historical election results describe past outcomes. They do not establish the personal motivations of individual voters.
Applications of Uttar Pradesh Historical Election Data Research
Historical election data can support a wide range of research, reporting and educational applications.
Political Research
Provides historical context for understanding electoral competition and party performance across elections.
Academic Studies
Supports research into democratic participation, electoral systems and historical political change.
Election Journalism
Helps journalists compare previous election results and explain changes in political representation.
Data Visualization
Supports the creation of tables, charts and reports that make historical results easier to understand.
Constituency Research
Provides detailed records of candidates, party results, vote share and winning margins over time.
Public Information
Makes historical election information more accessible to citizens, students and researchers.
Why Choose Click2Public for Historical Election Data Analysis?
Click2Public Technologies focuses on structured election data research, historical result comparison and constituency-level analytical reporting.
Historical electoral information often exists across multiple reports, election years and geographical levels. Organizing this information into a consistent format makes it easier to study.
Structured Election Data
Organized election datasets can help researchers compare historical results across constituencies and election years.
Constituency-Wise Reporting
Detailed constituency reports can bring together candidate results, party performance, turnout and winning margins.
Historical Vote Share Comparison
Vote share analysis helps examine changes in party performance across multiple election cycles.
Election Data Visualization
Charts and comparison tables make complex election data more understandable.
Booth-Level Research
Where verified records are available, polling-station data can provide additional detail for historical analysis.
Evidence-Based Reporting
Clear methodology and source verification help ensure that election research is transparent and reproducible.
Uttar Pradesh Historical Election Data Analysis FAQs
What is Uttar Pradesh Historical Election Data Analysis?
It is the systematic examination of previous Assembly and Lok Sabha election results, party performance, candidate vote totals and historical voting trends.
Why is historical election analysis important?
It helps researchers understand changes in electoral competition, party representation and voter participation over time.
How many Assembly constituencies are in Uttar Pradesh?
Uttar Pradesh has 403 Legislative Assembly constituencies.
How many Lok Sabha seats are in Uttar Pradesh?
Uttar Pradesh has 80 Lok Sabha constituencies.
Can historical election results be compared constituency-wise?
Yes. Constituency-wise results can be compared across elections, provided boundary changes and other relevant differences are considered.
What is booth-wise election data analysis?
It examines election results at the polling-station level where reliable official records are available.
What is the difference between vote share and seat share?
Vote share measures the percentage of valid votes received, while seat share measures the percentage of seats won.
What is a winning margin?
A winning margin is the difference between the votes received by the winning candidate and the runner-up.
Where can historical Uttar Pradesh election results be found?
Official historical results can be found through the Election Commission of India and relevant election authorities.
Can historical election data predict future election results?
Historical data can identify past patterns, but it cannot reliably predict future election outcomes.
Understanding Uttar Pradesh's Electoral History Through Data
Uttar Pradesh Historical Election Data Analysis provides valuable insight into the state's changing political and electoral landscape.
By examining previous Assembly and Lok Sabha elections, researchers can understand historical party performance, constituency-level competition, voter participation and changes in political representation.
Detailed vote share comparisons, winning margin analysis and polling-station research can provide additional context beyond statewide election results.
However, meaningful historical analysis requires accurate source records, consistent methodology and careful interpretation of electoral data.
Click2Public Technologies supports structured election research and analytical reporting to make complex historical electoral information more accessible and understandable.
Explore Assembly Data Analysis Report